This thread has been locked.

If you have a related question, please click the "Ask a related question" button in the top right corner. The newly created question will be automatically linked to this question.

LMX2594EVM: Spurious not found in the simulation

Part Number: LMX2594EVMLMX2594EVM
Other Parts Discussed in Thread: LMX2582

Hello team,

My customer has a question about spurious of LMX2594EVM.

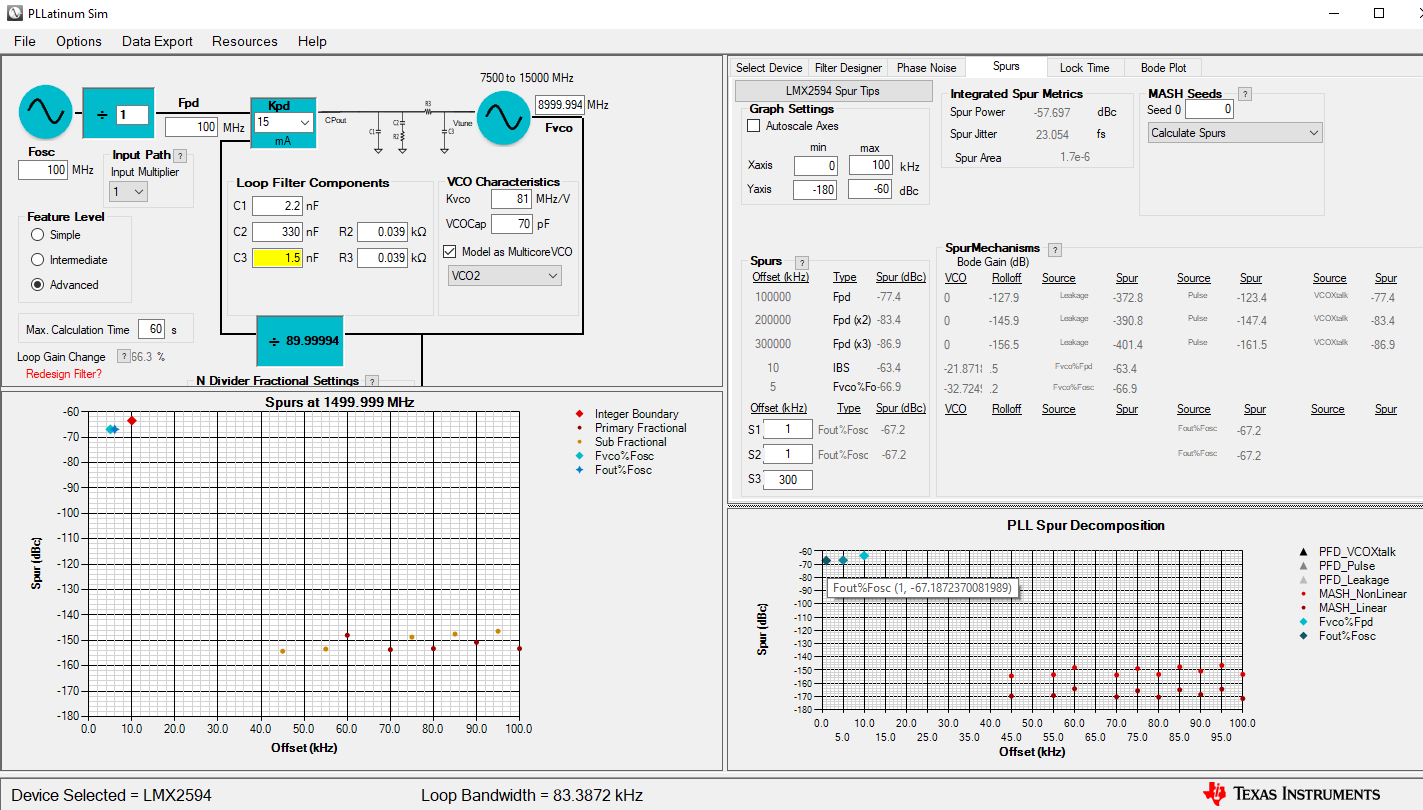
When the customer used in the decimal division mode (fout = 1499.999MHz) on the LMX2594EVM, spurious at offset 1kHz, which was not visible in the simulation software "PLLatinum Sim", is visible at a high level.

Their 5 questions are listed below:

Why spurious, which was not seen in simulation software, can be seen at a high level on the actual machine (LMX2594EVM)
(1) Is this level of the deviation from the analysis result within the assumption?
(2) If it can be solved by setting parameters, etc., they want to know the parameters.

Also, please give some advice about the followings related with parameter settings.
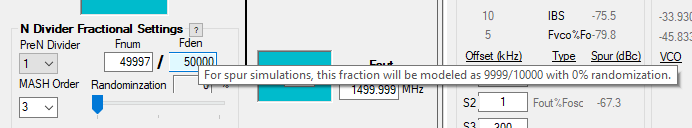
(3) Definition of "MASH_ORDER" that seems to be related to spurious level
(4) Difference in how the spurious level looks depending on whether the "MASH Clock Distortion" check is ON / OFF on the simulation software.
(5) Is the level of IBS Spur Metrics the sum of all spurious levels in band, not the spurious level per 1Hz?

Best Regards,
Ryotaro Fukui

  • Hi Fukui-san,

    I can see the 1kHz spurs from PLL Sim 1.5.6.0, it is shown at the bottom in the right column. 1kHz spurs is expected as this is a fractional spurs and crosstalk spurs. If you can scarify phase noise, you can change PLL_DEN to 5000001. Doing so will avoid fractional spurs, leaving crosstalk spurs behind. Hopefully this will reduce the overall spurs level. 

    MASH_ORDER = delta sigma modulator order. Higher order, in general, will result in smaller spurs.

    There is no MASH Clock Distortion and IBS spur metrics anymore in the latest PLL Sim.

  • Hi Fung-san,

    Thank you for the feedbacks. I received their updated result regarding your answers, and also some additional questions about it. It will be helpful if you could answer these too.

    • The spurious level seen on the screen of "PLL Spur Decomposition" at the bottom right of the simulation screen is as low as -60dBc, but the spurious level actually confirmed with a spectrum analyzer was about 30dB higher than that. Is this discrepancy expected between the simulation and the actual machine results?
    • They would like to know the reason why the actual spurious level does not decrease even if MASH_ORDER is changed.
    • Which should they refer to? The spur screen on the bottom left or bottom right? Since it says "Decomposition", they understand that the components of the lower left spurious are displayed in the lower right, but why is the offset 1kHz spurious not displayed in the lower left screen?

    Best Regards,

    Ryotaro FukuiLMX2594EVM_large_spurious2.pptx

  • Hi Fukui-san,

    Spurs frequencies are predictable but spurs level cannot be simulated accurately. This is because for the same spurs frequency, there exist multiple spurs sources. If the phases of these spurs sources are similar, then the spurs level is going to be big. On the contrary, if their phases are different, then the ultimate spurs level may be smaller. In addition, the spurs due to crosstalk are not able to be modeled. In summary, PLL Sim can help you find out the spurs frequencies at different configuration / loop filter characteristic. As for the spurs level, they are good for reference only.

    Modify MASH_ORDER may reduce spurs due to PLL, but it is not able to deal with crosstalk spurs. So, depending on the actual spurs mechanism, very often that using a different MASH_ORDER cannot help reducing the spurs level, but it may help reducing the number of spurs.

    I will let the tool owner know the problem of displaying different spurs in the plots and fix it in next revision release.

  • Hi Fung-san,

    Thank you for your answer.

    So, it's difficult to predict the level because of the unmodelable component of crosstalk spurious. I would like customers to use the spurious level as a reference only. Though level of spurs has risen a little, but the number of spurs has decreased, so is this result as expected?

    Also, the difference between the left and right screen displays was a bug caused by the tool. Can I think that there is no difference in the contents of the two screens? Thank you for sharing the information with the tool developers.

    Best Regards,

    Ryotaro Fukui

  • Hi Fukui-san,

    Right, with different MASH configuration, we can predict the number of known spurs due to PLL.

    I think the plot on the left is a simplified version, otherwise there is no point showing two identical plots.

  • Hi Fung-san,

    Thank you for your confirmation.

    You said you think the left plot a simplified version, but is it okay to tell the customers that? I was worried about the part "I think".

    We also receive additional questions from our customers regarding spurious emissions.

    • Customers speculate that the spurs component that appears every 1kHz is the fout% fosc component. Are these component the crosstalk spurs that you mentioned earlier in the conversation?
    • We have also received feedback from our customers that the spurious results differ greatly between Dev.B and Dev.C of EVM. I would appreciate it if you could tell me the reason for this as well.

    Best Regards,

    Ryotaro Fukui

  • Hi Fukui-san,

    Let me check with the tool developer to clarify the plots.

    As for the 1kHz spurs, with DEN = 50000 and third order MASH, I can predict fractional spurs and crosstalk spurs appear at the same frequency offset: 1kHz, 2kHz and 6kHz. 

    The sources of the 1kHz spurs are PLL; crosstalk between RFout and fpd; crosstalk between RFout and the reference clock. So it is not surprise that the spurs level will be different between EVMs. I am sure you will see different spurs level if you are using different reference clock source.

  • Hi Fukui-san,

    I checked with the tool developer, the reason that 1kHz spur was missing on the left plot is because of the "memory size" limitation of the tool.

    If you mouse-over the Fden block, you can see the tool tips. So the simulation was actually done with a fraction of 9999/10000. As a result, there is no 1kHz spurs. 

    On the right plot, it was purely a calculation and we were able to revert the 1kHz spurs. 

    This discrepancy is not ideal, we will look into it and see how to fix it. 

  • Hi Fung-san,

    Thank you for your answer. I'm not familiar with this area, so I'd appreciate it if you could briefly tell me what fractional spurious is.

    As a confirmation of my understanding, the level of spurious is significantly different from the simulation result. Is it okay to understand that this is because the unpredictable crosstalk spurious overlaps with the predictable fractional spurious in the actual test?

    Also, you mentioned that different reference clock sources have different spurs, but have there been any major changes between Dev.B and Dev.C? Or are you talking about individual differences? Spurious levels vary greatly from these 2 EVMs, is this a normal result?

    Best Regards,

    Ryotaro Fukui

  • Hi Fung-san,

    I have also received a file with the settings exported by the customer, and would like to share it.
    I hope it will help them understand why spurious levels are high in their EVM and how they can lower the peak of spurious.

    Best Regards,

    Ryotaro FukuiLMX2594EVM_settings.zip

  • Hi Fukui,

    The accuracy of a simulation tool depends very much on a well modeled database, but it is not always easy to have that model created. We can calculate the spurs frequencies based on the PLL configuration (see LMX2582 datasheet section 8.1.1 for details), we can also calculate some of the spurs level based on theory but we are not able to model the crosstalk spurs. In addition, it is very likely that the same spurs is created by multiple spur sources. As a result, the spurs level is not predictable as we don't know the phases of these spurs sources. Two EVM could return different spurs level as the phases of the spurs sources could be different. 

    According to their configuration, I can foresee crosstalk spurs at multiple of 1kHz; multiple of 6kHz from crosstalk and PLL; multiple of 60kHz from PLL. The loop bandwidth is over 80kHz, the spurs created from the PLL will pass through to the VCO output without attenuation. You may change PLL_DEN to something like 1234567, this will change the PLL spurs frequency, hopefully this will help.

  • Hello Fung-san,

    Customer would like to confirm that the spurious levels currently occurring in EVM are reasonable.

    If it is possible to figure out how to reduce the peak spurious value by using simulation, that is fine, but if it is difficult, is it possible to measure spurious in EVM and compare the result with the customer's EVM?

    If the results are the same, they will continue to use them with current spurs level, and if the results are different, you will be able to identify problems with their circuit and measurement methods.

    Which would be better to find out how to reduce the peak level?

    Best Regards,

    Ryotaro Fukui

  • Hi Fukui-san,

    The EVM performance will be identical unless there is flaw during EVM production. There may be some variation in spurs performance because crosstalk spurs may vary.

    Speaking of the 1kHz (5kHz or 6kHz) spurs, since they are inside the loop bandwidth, the loop did nothing to tackle them. As a result, the spurs level will always be high. There is nothing we can do to reduce their level.

  • Hello Fung-san,

    In response to the previous question, "What is the difference between left and right graph?", the answer was  "The plot on the right is a pure calculation result, and the 1kHz spurious is displayed normally."

    Given the above, should I refer to the screen on the right for the frequency components that are originally predicted to be spurious? What about the offset component spurs that appear on the left and not on the right?
    For example, Fvco% Fpd should be seen as a spurious at offset: 6kHz in the settings parameters of the file I sent earlier, but it does not appear on the screen on the right.
    (* Although you can see it on the screen on the left, if it is the color of the marker, the component is Fout% Fosc, and I think that this should appear 1kHz away originally)

    Best Regards,

    Ryotaro Fukui

  • Hi Fukui-san,

    Right, the right plot did not capture 6kHz spurs. I checked this with the developer, it appears that the calculation is correct but due to round-off error, the graphic displayed it at 5kHz instead of 6kHz. We will try to fix this in next revision. Thank you for pointing this out to us.