This thread has been locked.

If you have a related question, please click the "Ask a related question" button in the top right corner. The newly created question will be automatically linked to this question.

ADS1299: ADS1299: Verifying Test Singal on all channels of ADS1299, waveform is showing peaks on rising and falling edge

Part Number: ADS1299

Tool/software:

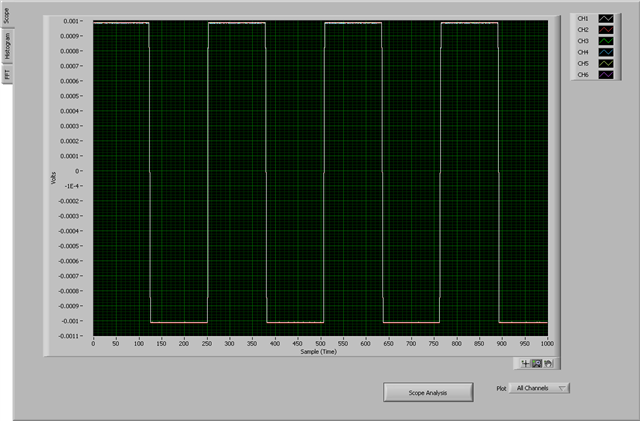
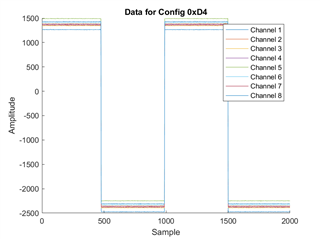
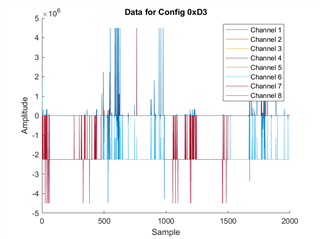
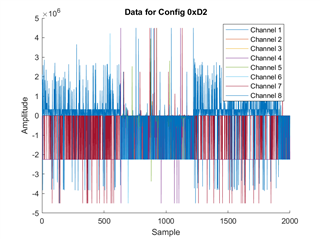
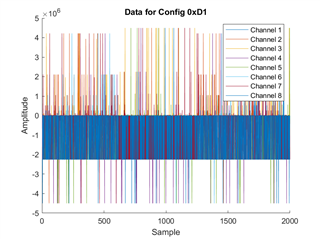
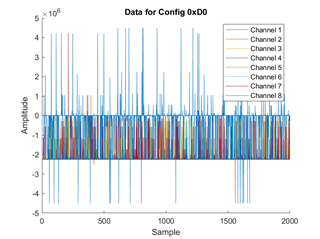
I am in process of programming and controlling ADS1299 using a Microcontroller and for now I am successfully able to read device ID, able to read/write registers and now configured to generate test signal on all channels and plot them on serial port. Below is the screen short of the plot data. I am observing few weried rising/falling edges in test signal. Is it correct ? Currently all the data pins are open and below are my config register settings:

CONFIG1: 96
CONFIG2: D0
CONFIG3: EC
LOFF: 0
CH1SET: 5
CH2SET: 5
CH3SET: 5
CH4SET: 5
CH5SET: 5
CH6SET: 5
CH7SET: 5
CH8SET: 5
BIAS_SENSP: 0

Need opinion if it is correct ? Or any adjustments are required. I want to confirm before proceeding towards biosignals.

Thanks

  • Hello Jahan - the test signals look correct at first glance. What exactly is the concern?

    You may want to check how the output codes are converted back to volts. The differential test signal should be centered around mid-scale (0V) with an amplitude described by the register settings. You can refer to our EVM User Guide for an example:

    Regards,

    Ryan

  • Many thanks for the reply. I was concerned about the abnormal peaks on the rising and falling edge in the test signal.

    After some testing, I encountered a slightly different problem. When I increase the sampling rate, the test data on the channels starts showing garbage. For example, at 250 samples per second, all channels are correct. However, at 1k samples per second, I find that the last 3 channels show garbage data, as shown below. At the maximum speed of 16k samples per second, all channels display garbage.

    The last 3 plots are channel-6,7,8 and first plot is channel 1-5.

    Similarly when i set 16K samples in config-1, all the plots are showing garbage data:

  • Hi Jahan,

    To me, this appears to be a data capture issue, likely caused by a timing mismatch between when data is written into the output shift register (i.e. nDRDY falling edge) and when the host initiates/completes the data transfer. You must ensure that all data is completely read before the next nDRDY interrupt. The device's default mode (RDATAC) automatically overwrites the newest data into the output shift register.

    Regarding the spikes, this is unexpected, but I'm not sure what would be causing this at the moment. The square wave test signal passes through the PGA and a first-order LPF, so any overshoot/undershoot should be removed. In addition, the sampling rate is so low that I would not expect the ADC output to capture such behavior. Can you plot the raw decimal values and zoom in on just a couple periods?

    Regards,

    Ryan

  • After many trials, I decided to perform a test. The code below is used to read 2000 samples of data from all channels. The sampling rate is increased by one step and sent via the serial port. I used a serial datalogger to record the data. However, I observed that as I increase the sampling rate, I am unable to record the data. I have included the plots of the data as well as my logic to read and print the data. Please review it and guide me on what changes should be made to read and print data at maximum speed.

    Serial baudrate: (230400);

    SPISettings ads1299SPISettings(2000000, MSBFIRST, SPI_MODE1);

    CODE To read 2000 data samples from all channels and increasing sampling rate:

    for (uint8_t regValue = 0xD6; regValue >= 0xD0; regValue--) 
          {
            digitalWrite(ledPin, LOW);
            sendCommand(ADS1299_SDATAC);
            writeRegister(ADS1299_CONFIG1, regValue);
    
            // Print the current register value to the Serial Monitor
            Serial.print("Config1 Data: 0x");
            Serial.println(regValue, HEX);  // Prints the current register value in HEX
            startDataAcquisition();
            lastSampleTime = millis();
            sampleCount = 0;
              while (sampleCount < 2000)
              {
                if (digitalRead(ADS1299_DRDY_PIN) == LOW) 
                {
                  readAndPrintData();
                  sampleCount++;
                }
              }
    
              stopDataAcquisition();
              sendCommand(ADS1299_SDATAC);
              delay(10);
    
          }

    This is my read and print function code:

    void readAndPrintData() 
    {
      digitalWrite(ADS1299_CS_PIN, LOW);
      
      // Skip status bytes (3 bytes)
      for (int i = 0; i < 3; i++) {
        SPI.transfer(0x00);
      }
    
      // Read and print channel data
      for (int i = 0; i < numChannels; i++) {
        long channelData = 0;
        for (int j = 0; j < 3; j++) {
          channelData <<= 8;
          channelData |= SPI.transfer(0x00);
        }
        
        // Handle negative values
        if (channelData & 0x800000) {
          channelData |= 0xFF000000;
        }
        
        // Convert to microvolts
        float microvolts = (float)channelData * (4.5 / 0x7FFFFF) * 1000000.0 / 1.0; // Assuming gain = 1
        Serial.print(microvolts, 2);
        if (i < numChannels - 1) Serial.print(",");
      }
      Serial.println();
    
      digitalWrite(ADS1299_CS_PIN, HIGH);
    }

    My start data/stop data functions:

    void startDataAcquisition()
    {
      sendCommand(ADS1299_START);
      delay(10);
      sendCommand(ADS1299_RDATAC);  // Enter read data continuous mode
      delay(10);
    }
    
    void stopDataAcquisition()
    {
      sendCommand(ADS1299_STOP);
      delay(10);
    }

    Here are data plots:

    The code is run multiple times to record 2000 samples and change value of CONFIG-1 and then recordnprint using the same function...

    SORRY for long post but need help.

    May thanks

  • Hi Jahan,

    You will need to monitor the timing of nDRDY and ensure that the entire SPI communication frame (216 bits) occurs between two consecutive falling edges (i.e. data rate period). If it does not, then the data is overwritten and corrupted in RDATAC mode, which is the default mode. Please see the diagram below:

    Alternatively, you can try to use RDATA mode instead. To use RDATA mode, send the SDATAC command (11h). Then, following nDRDY falling edge, send RDATA command (12h) + 216 bits of 0b. This extends the frame, but allows you to overlap the next nDRDY without corrupting the current SPI transaction. Note: it is possible to miss a sample entirely in this mode, but it will prove that the issue at faster data rates is caused by this timing overlap.

    Regards,

    Ryan