This thread has been locked.

If you have a related question, please click the "Ask a related question" button in the top right corner. The newly created question will be automatically linked to this question.

DAC3484: DAC output contains spurious and output power is less

Part Number: DAC3484
Other Parts Discussed in Thread: CDCE62005, TRF3722, DAC3482

Hi

DAC CLK= 614.4 MHz

DATA CLK=307.2MHz

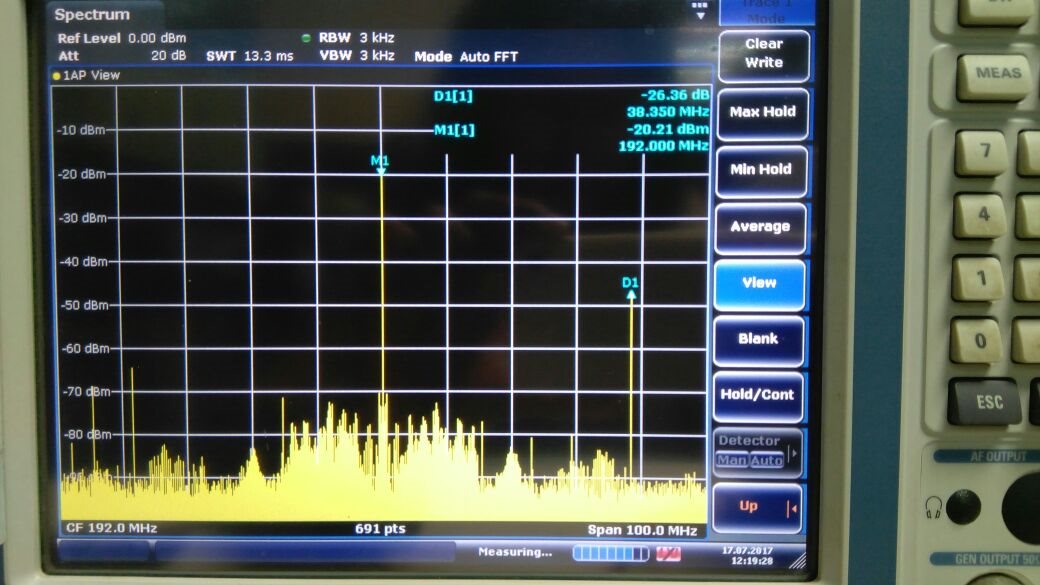
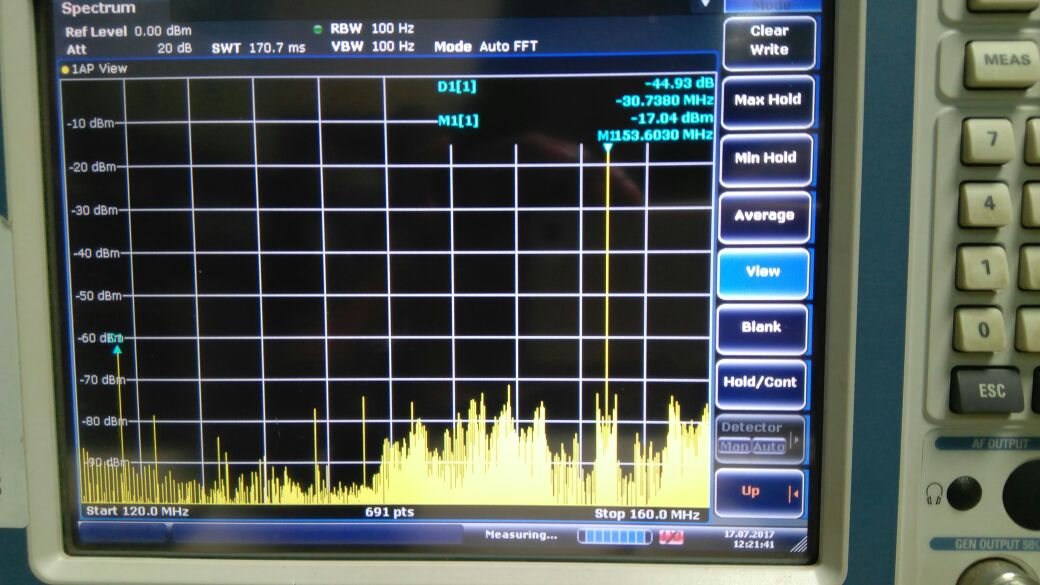
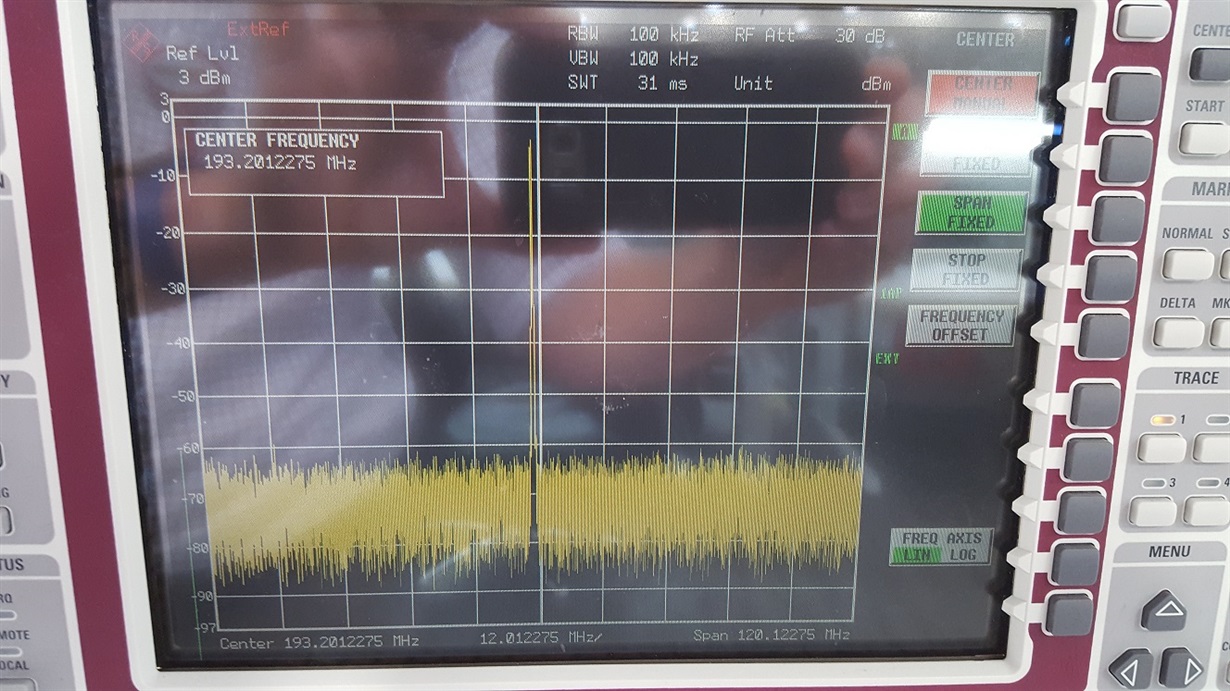
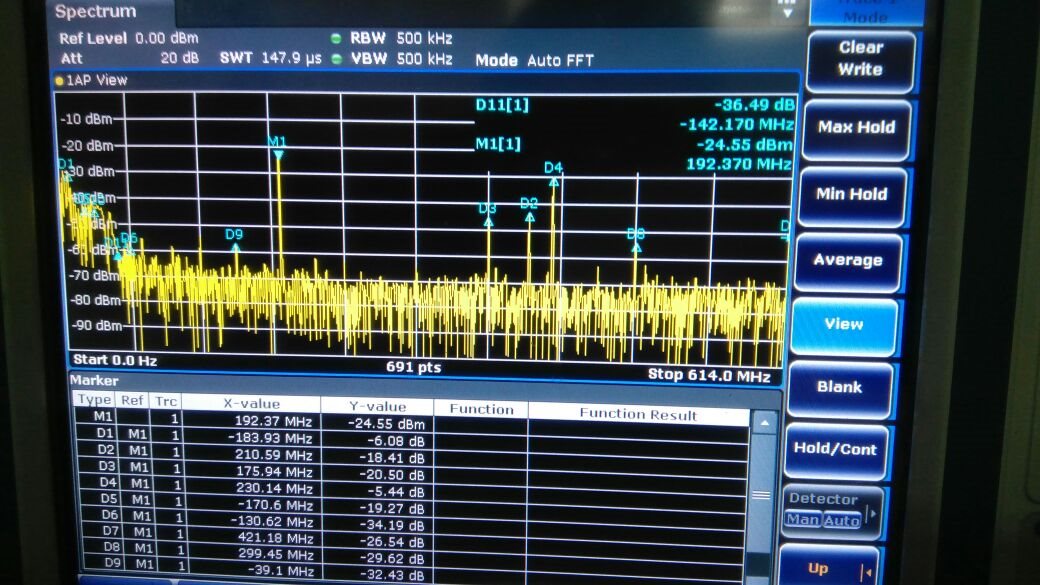
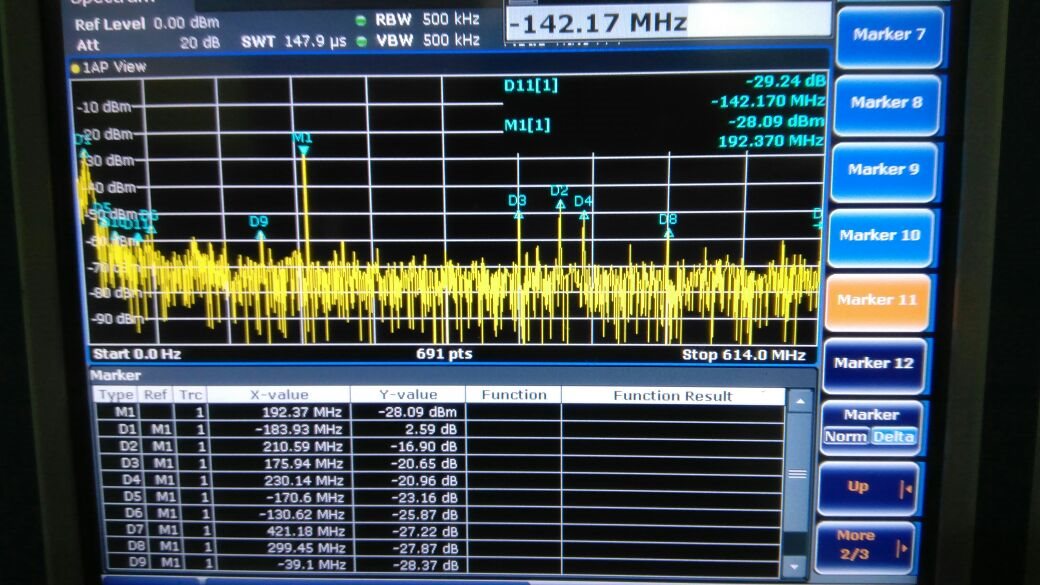
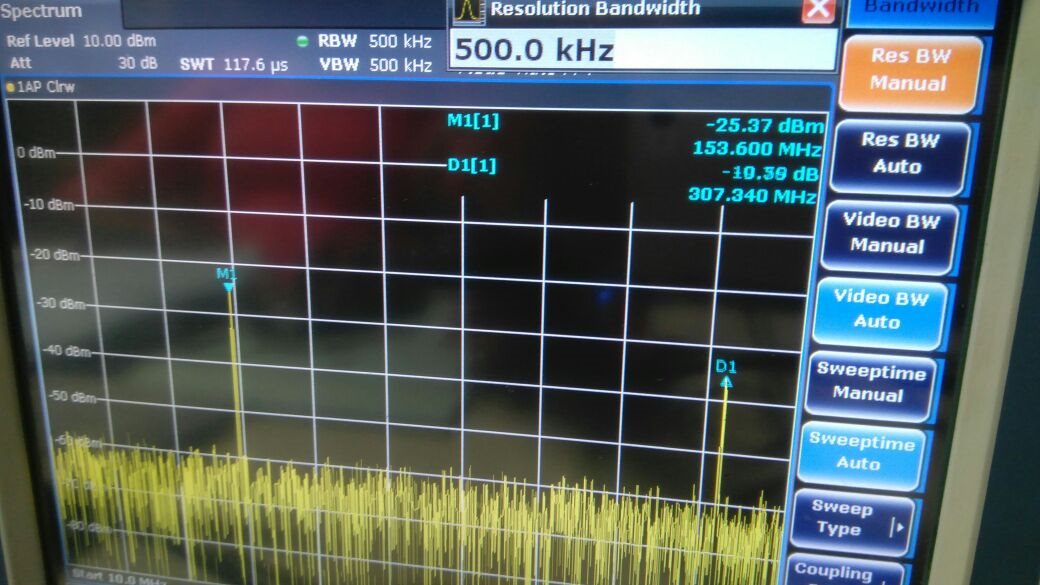
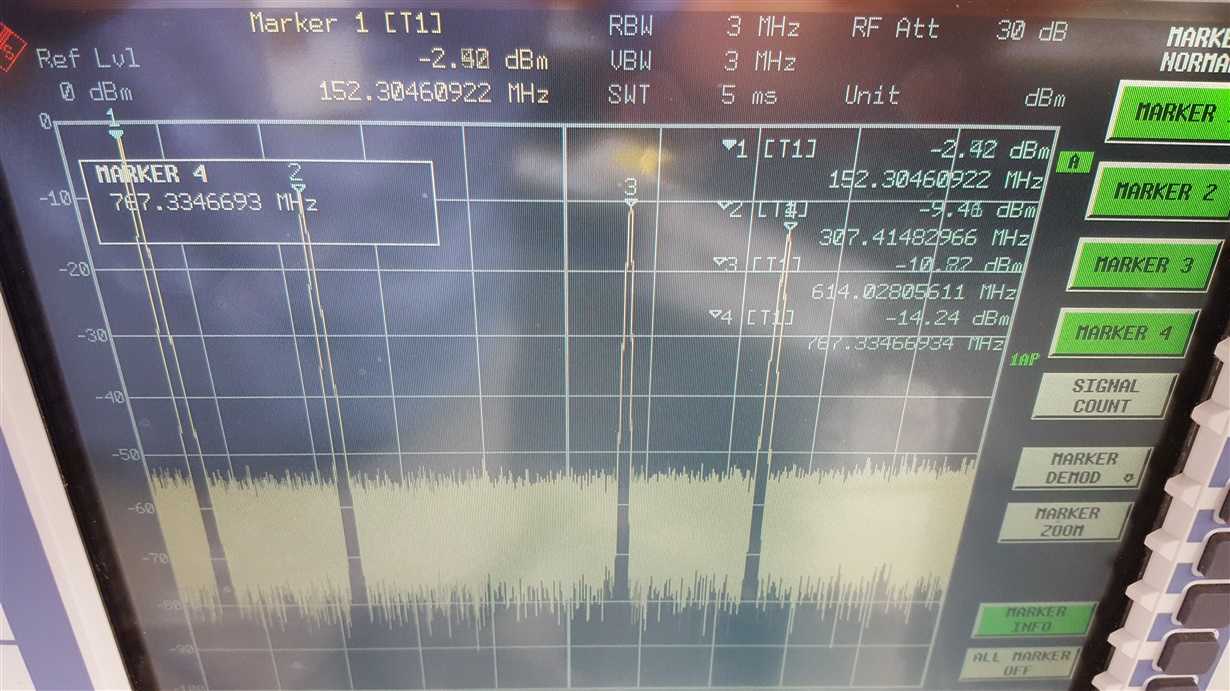
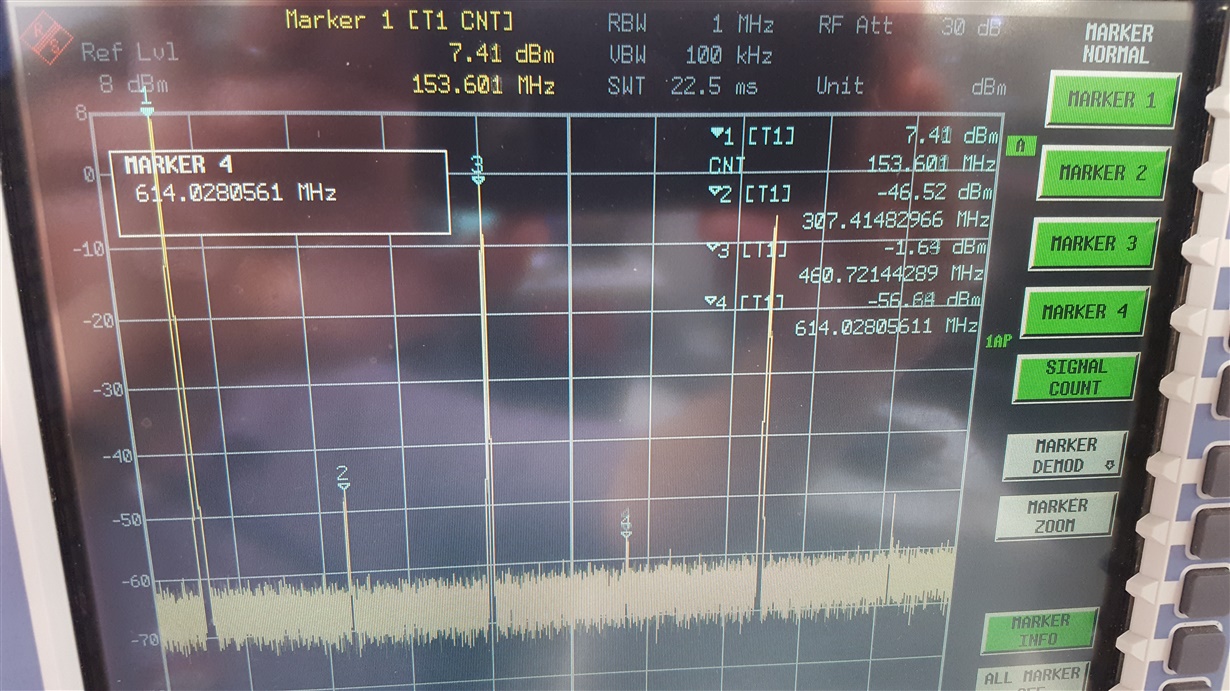
We are using DAC at self test mode and kept coarse gain at 1111, with Rbias=1.28k as recommended. Programming the code at 7FFF. (We are using sif_sync) Still the output is not as per datasheet. Moreover, we are getting one prominent spurious at the output which changes with output frequency. I am attaching images of DAC output for one channel at 192MHz output and othe rat 153.6MHz output. Since the spurious changes with frequency as seen in the pictures, when we sweep the output using NCO, we can see our main output sweeping with the spurious sweeping from opposite direction (as it changes with output frequency).

Please suggest a solution to this.

Please note that the large number of spurious other than the prominent ones may be because I have probed the DAC output and these might be pick ups from it.

  • Hi Sarika,

    I am looking into this, and should get back with you soon. If you can, please include any additional information that may be helpful.

    Regards,

    Dan
  • Hi,

    Register values of DAC in selftest
    reg_map(0) <= x"00_0298"; --alarm enabled
    reg_map(1) <= x"01_010E";
    reg_map(2) <= x"02_80D2";
    reg_map(3) <= x"03_A000";
    reg_map(4) <= x"07_C7FF";
    reg_map(5) <= x"08_0000";
    reg_map(6) <= x"09_8000";
    reg_map(7) <= x"0A_0000";
    reg_map(8) <= x"0B_0000";
    reg_map(9) <= x"0C_0400";
    reg_map(10) <= x"0D_0400";
    reg_map(11) <= x"0E_0400";
    reg_map(12) <= x"0F_0400";
    reg_map(13) <= x"10_0000";
    reg_map(14) <= x"11_0000";
    reg_map(15) <= x"12_0000";
    reg_map(16) <= x"13_0000";
    reg_map(17) <= x"14_0000";--- reg 0x14-0x17 IF=192MHz
    reg_map(18) <= x"15_5000";
    reg_map(19) <= x"16_0000";
    reg_map(20) <= x"17_5000";----
    reg_map(21) <= x"18_2000";
    reg_map(22) <= x"19_0000";
    reg_map(23) <= x"1A_0020";
    reg_map(24) <= x"1B_0800";
    reg_map(25) <= x"1E_8888";
    reg_map(26) <= x"1F_8888";
    reg_map(27) <= x"20_8801";
    reg_map(28) <= x"22_1B1B";
    reg_map(29) <= x"23_ffff";
    reg_map(30) <= x"24_0000";--datadlyclkdly
    reg_map(31) <= x"25_7A7A";----io test patterns
    reg_map(32) <= x"26_B6B6";
    reg_map(33) <= x"27_EAEA";
    reg_map(34) <= x"28_4545";
    reg_map(35) <= x"29_1A1A";
    reg_map(36) <= x"2A_1616";
    reg_map(37) <= x"2B_AAAA";
    reg_map(38) <= x"2C_C6C6";----io test patterns
    reg_map(39) <= x"2D_0005";--self test enable
    reg_map(40) <= x"2E_0000";
    reg_map(41) <= x"2F_0000";
    reg_map(42) <= x"30_7FFF";---self test value
    reg_map(43) <= x"05_0000";--clear all alarms
    reg_map(44) <= x"1F_888A";--sif sync
    reg_map(45) <= x"1F_8888";

    DAC CLK=614.4MHz. data rate=153.6MSPS. DATA CLK=307.2MHz. Interpolation=4. NCO
    programmed to 192MHz.

    Waiting for your reply and suggestions.
  • Hi Sarika,

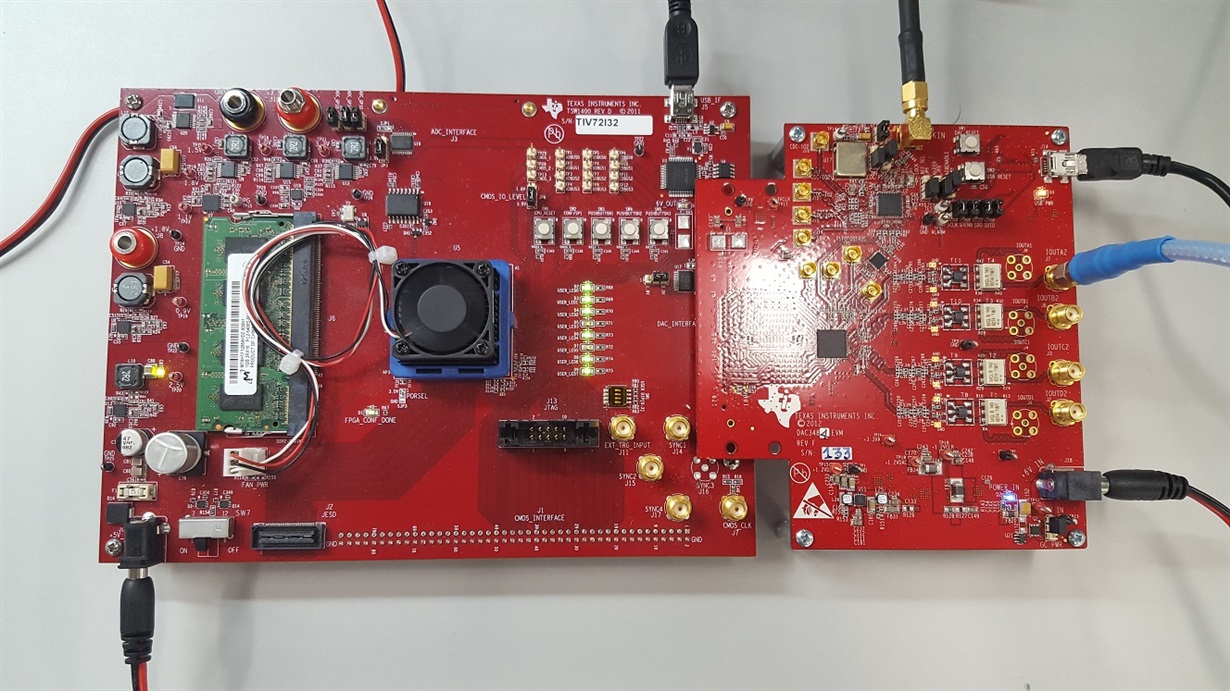
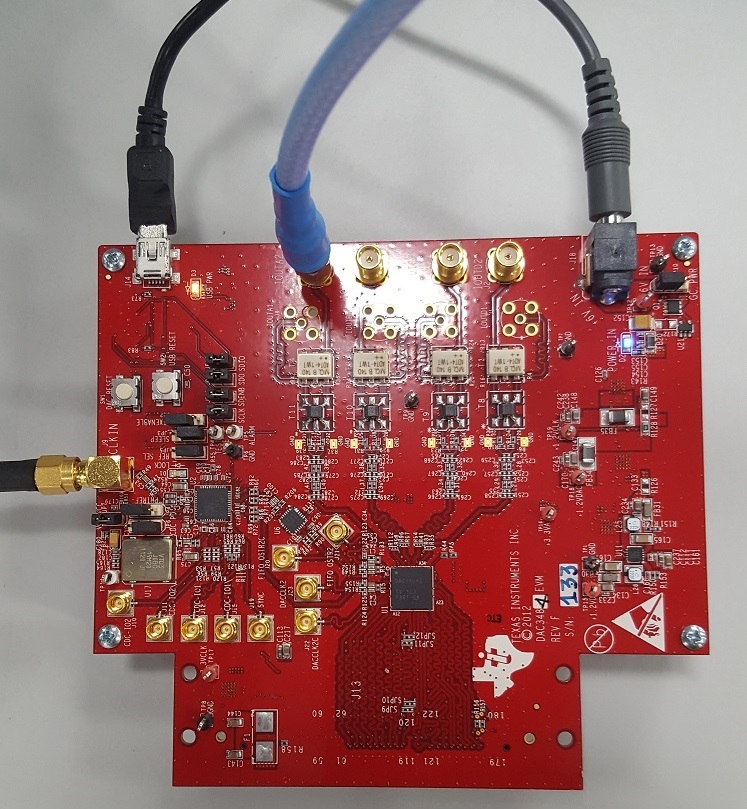
    I am using a TSW1400 REV D and  DAC3484 EVM REV F in order to perform some tests on my end (see pic below). Please let me know what your setup is, and whether you have made any modifications.

    I have setup a test using the clock frequencies and specifications that you provided above (DAC CLK=614.4MHz. data rate=153.6MSPS. DATA CLK=307.2MHz. Interpolation=4) , and was able to generate a clean signal at NCO of 192 MHz. I used HSDC Pro to send a single tone to the DAC.

    Below are the relevant register writes that I used, directly from the DAC3484 GUI txt file. Assume all other registers are in default state.

    x00 xF28C
    x01 x0100
    x02 x8052
    x03 xA001
    x04 x4DF1
    x05 x0660
    x06 x2C00
    x07 xFFFF
    x08 x0000
    x09 x8000
    x0A x0000
    x0B x0000
    x0C x05A6
    x0D x05A6
    x0E x05A6
    x0F x05A6
    x10 x0000
    x11 x0000
    x12 x0000
    x13 x0000
    x14 x0000
    x15 x5000
    x16 x0000
    x17 x5000
    x18 x205F
    x19 x10F0
    x1A x4820
    x1B x0800
    x1C x0000
    x1D x0000
    x1E x1111
    x1F x8882
    x20 x2400
    x22 x1B1B
    x23 x001F
    x24 x1000
    x25 x5A7A
    x26 xB6B6
    x27 xEAEA
    x28 x4545
    x29 x1A1A
    x2A x1616
    x2B xAAAA
    x2C xC4C4
    x2D x0004
    x2E x0000
    x2F x0000
    x30 x61A0
    x7F x0004
    CDCE62005 Registers
    Freq:0.000000MHz
    Address Data
    00 80400000
    01 813C0001
    02 81400002
    03 C1040003
    04 00040004
    05 29F01A55
    06 44AF0006
    07 165294A7
    08 20001808

    Hopefully, you should see something similar. Let me know how it goes.

    Regards,

    Dan

  • Hi Dan,

    We have kept your code on our board but have kept DAC on self test mode. We are still observing The same spurious as seen in the pics above. We have made one observation this time:

    1. For IF =  192MHz,  2nd_harmonic=384M. 2nd harmonic will be folded back to 1st nyquist

    zone=614.4-384=230.4M delta with respect to IF=230.4-192=38.4M. Hence we are seeing this spurious in our output. Please refer to the pics sent earlier.

    2. Similar observations can be made for all IF below:

    DAC NCO ,MHz Power @ IF ,dBm Offset from IF, MHZ dB below IF power
    180 -10.2 74.38 -22.8
    192 -12.4 38.4 -21.4
    195 -11 29.58 -21.8
    205 -10 -0.608 -28
    225 -10 -60 -32
    230 -10 -75 -33
    235 -10 -90 -33

    So, looks like NCO(IF) 2nd harmonic is folding back to 1st nyquist zone. 

    Please suggest how to remove this component.

  • Hi Sarika,

    Thank you for sharing these observations. I believe you are correct in regard to the 2nd harmonic, and I am confident that we can figure this out.

    In order for me to replicate what you are seeing, I need to make sure we are testing the same way.

    Are you using an FPGA and DAC 3484 EVM like the picture in my previous post? Is the DAC 3484 GUI used at all to program the registers?

    What are you meaning by "Self Test" mode, as I do not see reference to this mode in the data sheet? I assume this means that you are only using the NCO for testing, and not providing a digital signal to the DAC.

    In the mean time, I'd like you to give something a try. Using only the DAC 3484 EVM (in pic below), connect a 614.4MHz DACCLK at J9 (CLK_IN) along with USB and power. Connect signal analyzer to IOUTA2 (J7).

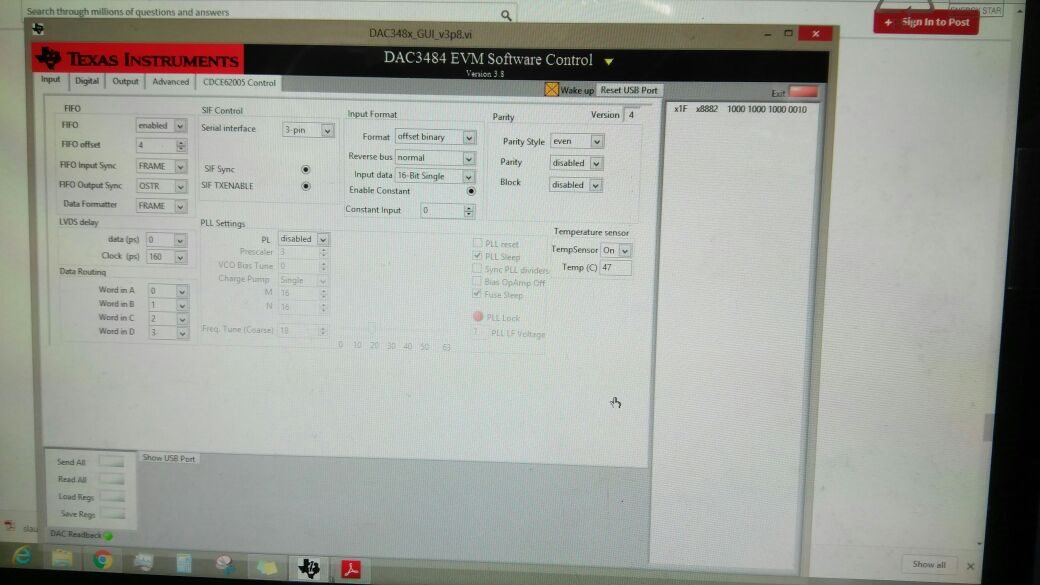
    Launch the DAC348x_GUI (IMPORTANT - Install and launch GUI as administrator) and click on the "Input" tab. Please ensure you settings reflect that of the image below.

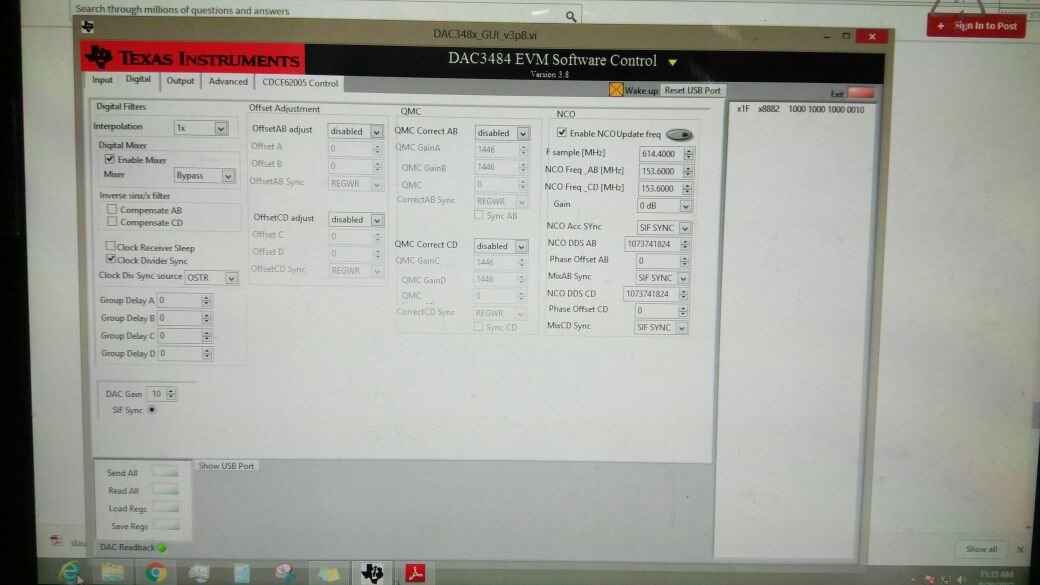
    Next, please click on the "Digital" tab. Here, you will need to enter the NCO "Sample (MHz)" and "Freq_AB (MHz)", and then click the oval button "Enable NCO Update freq".

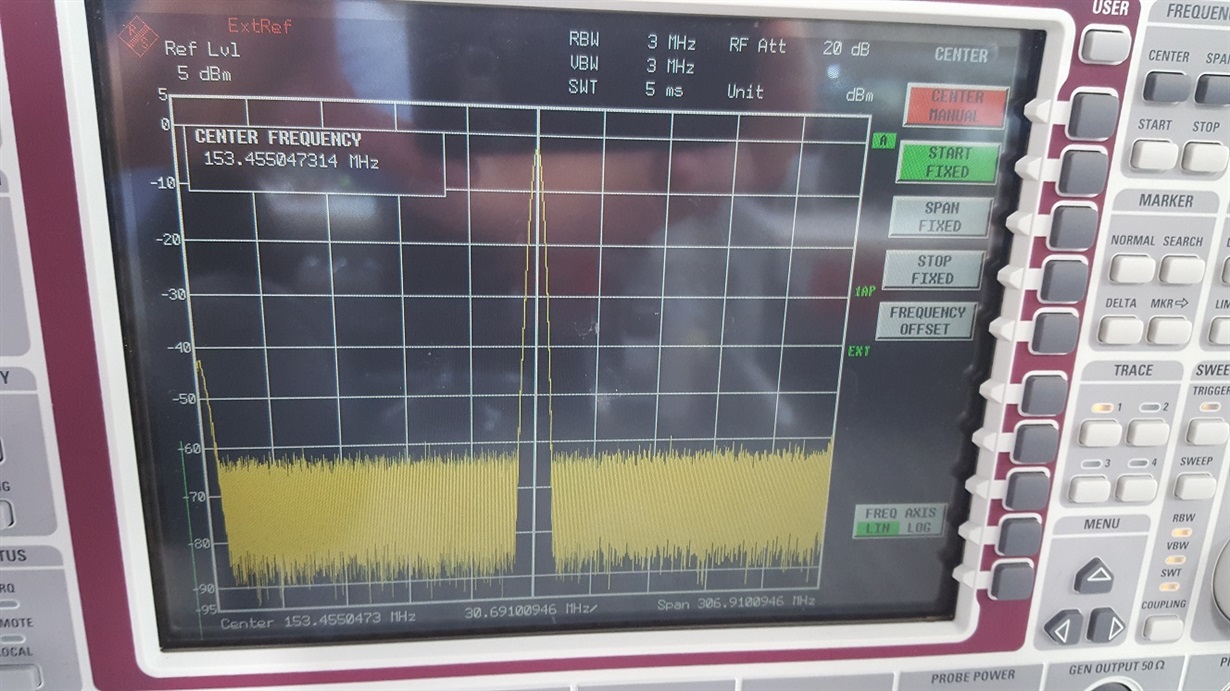
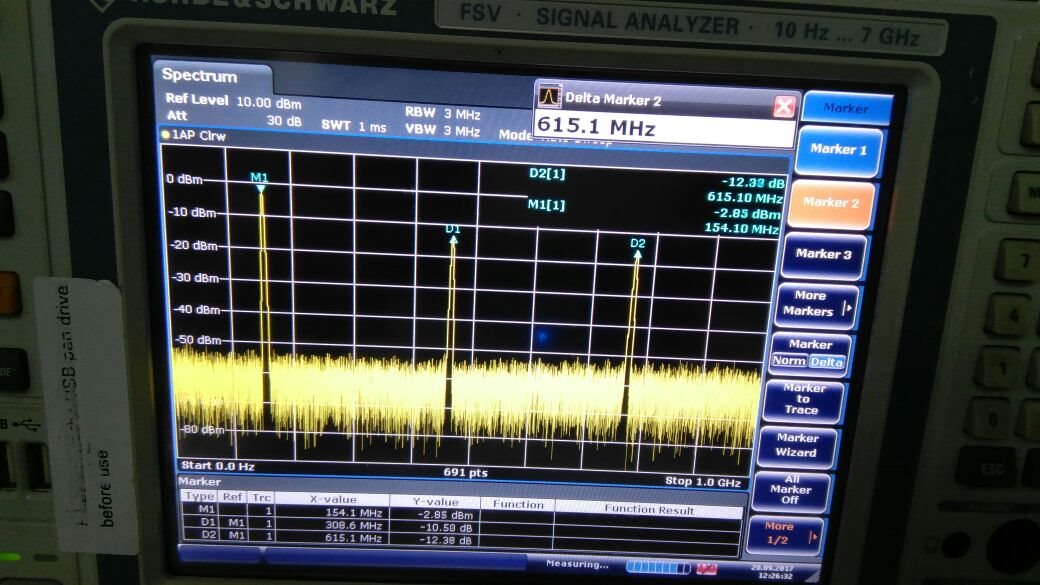
    At this point, you should see a tone at the NCO frequency (153.6 MHz) on your spectrum analyzer (similar to the picture below).

    Please let me know if your able to get the same results as I have shown following these steps.

    Thanks in advance,

    Dan

  • Thanks Dan for the quick reply.

    We are not working on the eval boards. We have our own custom digital and analog boards. Digital board has xilinx fpga(XC7k160T). Analog card has DAC3484 chip. Schematic of DAC3484 on our board has been shared earlier for your reference. Since its not the eval board, we are not programming DAC through GUI. Xilinx FPGA on our digital board programs it.

    we meant "enable constant"(as per GUI) sifdac_ena='1' as per datasheet by dac self test. Yes we are isolating data interface and just testing DAC NCO.

    Currently we don't have dac eval board with us. We are trying to get it on loan from local support team.

    In general when do we see such dominant 2nd harmonic.Can you please suggest something to try on our custom board.

    Thanks in advance,

    sarika

  • Hi Sarika,

    Thanks for the clarification! I do have something I would like for you to look at on your custom board.

    The compliance voltage for your analog output (according to the data sheet) should be between 0.6V and -0.5V (about 1 vpp). With the coarse bits set to 1111 (0xF) and Rbias = 1.28k (as you mentioned earlier), the full scale output current should be at 20 mA. This means that your output resistance should be around 25 ohms in order to not exceed these limits (0.5V =20mA * 25 ohms).

    A quick way to see if this is your issue is to reduce the output current. Try setting the coarse bits to 0111 (0x7) to see if the output current scales down. The hope is that the output will no longer exceed the compliance voltage, and the spur's power will be drastically reduced (somewhere around -50 dbc).

    Could you post the schematic that includes your analog output? Also, could you post a time domain (oscilloscope) capture of the output? With the spur being that strong relative to the fundamental, there should be some visible distortion of the waveform in the time domain.

    Regards,

    Dan

  • DAC SPURIOUS.pptxHi Dan,

    I have attached a ppt where I have kept images keeping coarse bits at F,7,A,5. So there are two cases to compare, (F & 7) and (A & 5).

    We have noticed that on decreasing the coarse bit value, we are obtaining lesser power output plus the spurious is also decreasing in dbc. We can also notice clear distortion in oscilloscope output when we keep F in coarse bits. But even when we keep coarse bits as low as 5 (0101), the spurious still exists.

    Please check and help us solve this.

  • Dan,

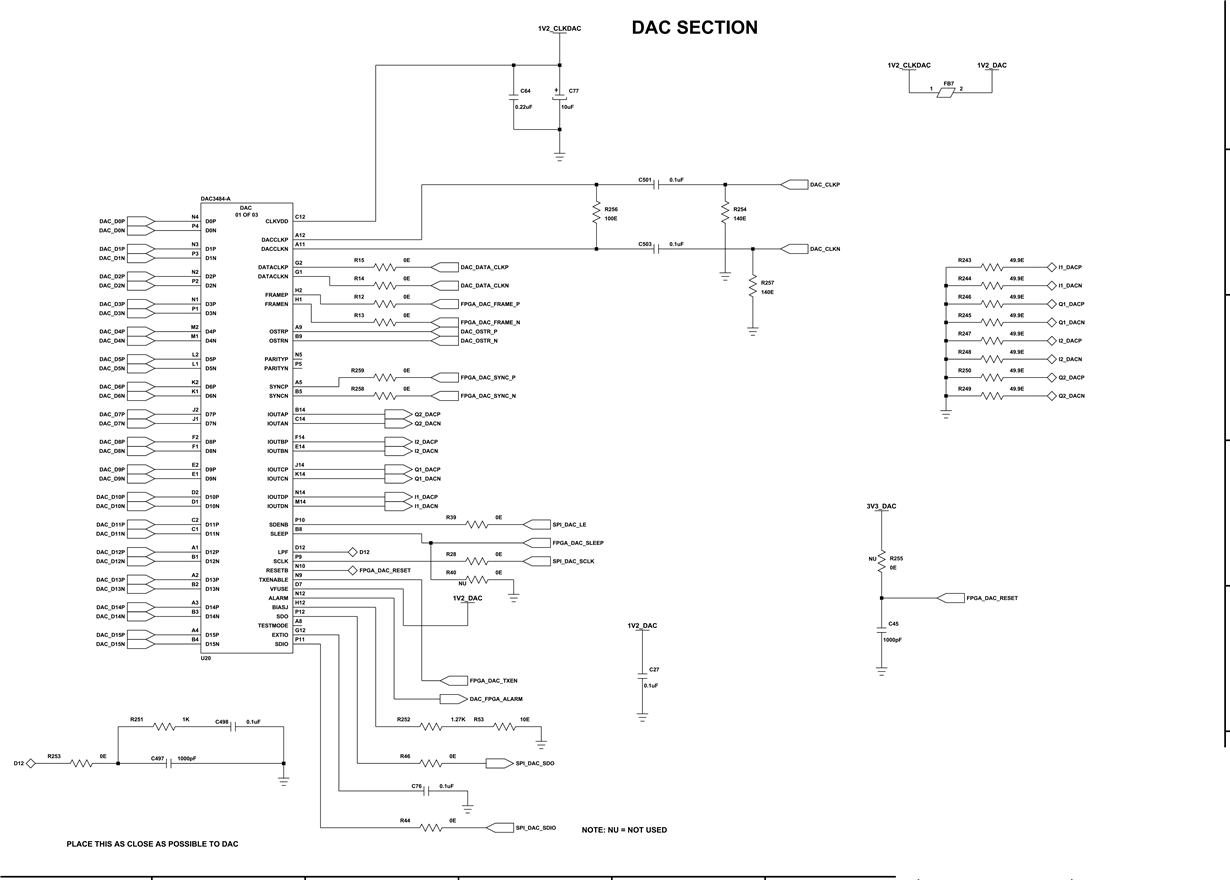
    PFA containing the schematic withDAC output. Pleae note that every time we are measuring output with DAC connnected to the next stage as well as DAC output being isolated by unmounting the filter components. We have observed similar results just that the output power varies a bit as seen from spectrum analyser. When seen from oscilloscope, the path with DAC output mounted show clear sine waves and the isolated path shows distorted waveform.

    8816.DAC SPURIOUS.pptx

  • Hi Sarika,

    Thank you for providing this detailed information. One thing I noticed right away is that your output (time domain) is driving beyond the +0.6 compliance voltage limitation. This will cause distortion on your output.

    When using code F (1111) for 20 mA full scale current, it appears the DC bias is sitting near 650 mV. Clearly, this exceeds the threshold, and any additional AC signal swing will push it further over the bound. As you reduced the full scale current (as in the other measurements you took), you can see that the DC bias (time domain) is reduced, and the spurious result (frequency domain) is significantly reduced to 40dBc. The datasheet shows that, at 200 MHz, you should be seeing around 60 dBc for this spur, so we have about 20 dB to make up.

    Additionally, the DAC output schematic you provided shows a filter, but I do not see any termination for the DAC or the load. Are you only terminating to the load (next stage)? If you wish to take measurements directly from the DAC output (before your filter), you must provide some termination for the DAC. The data sheet recommends 25 ohms if you are using 20mA full scale output current. Take a look at section 7.3.18 in the data sheet for exact value selection for your output current.

    If you can, I would like to see what the output of your DAC looks like when properly terminated, as described above. Please ensure that your output voltage does not exceed +0.6V or -0.5V (this included the bias + signal swing). If you are within these constraints, the spur should be significantly reduced. As you did previously, a screenshot of the time and frequency domain would be very helpful.

    Regards,

    Dan

  • Hi Dan

    We have kept 50Ohms terminations at the output of DAC and the input of the next stage which is TI trf3722 IC. The 50ohms at DAC output can be seen on the first page of the schematic I sent on the right most of the page.

    For all the measurement you have mentioned earlier, we have taken observations with 1) the filter components mounted (which has input and out terminations as 50 ohms) by probing on the DAC output via; 2) after unmounting filter components and probing on the same via, so effectively we are probing at 50ohms DAC termination resistors. We obserced that in the later case, the time domian waveforms were pretty distorted and of higher voltage levels, similarly, on spectrum analyser, we observed that the output power was 3dB higher.

    Do you want me to check the later case with 25ohms DAC ternimations (rather than present case of 50ohms)?. I want to highlight again that in this case components of the filter has been unmounted isolating DAC from the next stage.
  • Hi Sarika,

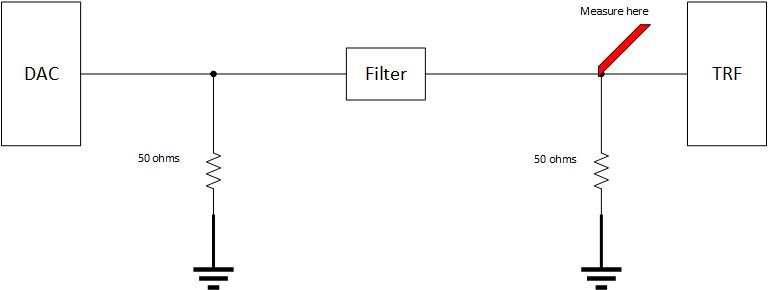
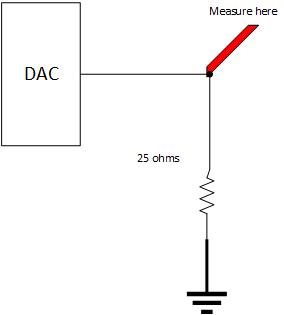
    Sorry, I did miss the DAC terminating resistors, so thanks for pointing them out. You are correct in that 50 ohm termination should be on the DAC output and the TRF input, and you should be able to take a valid measurement at the input to the TRF, as seen in the simplified, single-ended drawing below.

    I believe that the measurements you took, as described in your last post, are totally valid based on the following.

    In reality, the requirement for the DAC (and TRF) is that they must see 25 ohms at their respective terminals; however, the filter needs to have 50 ohms at its input and output (assumption based on filter design). That’s why we have the two 50 ohm resistors in parallel across the Filter (DAC and TRF still see 25 ohms since 50 || 50 = 25).

    So, in order to measure only the DAC output, you will need to connect the output to 25 ohms to ground, as seen in the drawing below.

    Taking the measurement with 50 ohm termination at the DAC output, while being isolated from the filter, will cause the output to exceed the compliance voltage (0.6V to -0.5V), and the signal will be severely distorted. This is just ohms law since the higher resistance (expecting 25 ohms but have 50 ohms) with the same current will cause a higher voltage drop.

    If you could, please attempt to make this measurement, the isolated DAC output using 25 ohm termination, in order to help eliminate the possibility of the filter or TRF causing the signal distortion that is being seen. You should notice a much cleaner time domain signal, and the spur should also be reduced in the frequency domain.

    Regards,

    Dan

  • Hi Dan

    Sorry for delay in reply. I have taken measurement as mentioned in the image sent by you.

    When I use coarse bits as A, the oscilloscope output is as in the attachment.

    7318.Presentation1.pptx

  • Hi Sarika,

    Thanks for posting your results. In the interest of eliminating the problem being the compliance voltage of the output pins, did you try to tune the coarse bits to the lowest possible value (0)? The datasheet gives an equation that can help us predict the results at the output.

    So If you set the Coarse Bits to 0, you should get:


    Can you confirm that 1.875mA is at the output? With 1.875mA at the output (for both 25 or 50 ohm termination conditions), you should be well under the compliance voltage of the output pins (around 47 mVDC and 94mVDC, respectively) . I would be interested to see what the output looks like under these conditions.

    Furthermore, try these register settings for your DAC in the file included. There are only a few adjustments, with regard to the one I posted earlier, but it is what I am using in the lab here.

    DAC3484_614p4MHz_4xint_NCO_30MHz_QMCon.txt
       x00	   xF28C
       x01	   x0100
       x02	   x8052
       x03	   xA001
       x04	   xFDFD
       x05	   x0660
       x06	   x2D00
       x07	   xFFFF
       x08	   x0000
       x09	   x8000
       x0A	   x0000
       x0B	   x0000
       x0C	   x05A6
       x0D	   x05A6
       x0E	   x05A6
       x0F	   x05A6
       x10	   x0000
       x11	   x0000
       x12	   x0000
       x13	   x0000
       x14	   x0000
       x15	   x5000
       x16	   x0000
       x17	   x5000
       x18	   x205F
       x19	   x10F0
       x1A	   x4820
       x1B	   x0800
       x1C	   x0000
       x1D	   x0000
       x1E	   x1111
       x1F	   x8882
       x20	   x2400
       x22	   x1B1B
       x23	   x001F
       x24	   x1000
       x25	   x5A7A
       x26	   xB6B6
       x27	   xEAEA
       x28	   x4545
       x29	   x1A1A
       x2A	   x1616
       x2B	   xAAAA
       x2C	   xC4C4
       x2D	   x0004
       x2E	   x0000
       x2F	   x0000
       x30	   x61A0
       x7F	   x0004
    CDCE62005 Registers
    Freq:0.000000MHz
    Address	Data
    00		80400000
    01		813C0021
    02		81400002
    03		01040003
    04		00040004
    05		29F01A55
    06		44AF0006
    07		165294A7
    08		20001808

    In the meantime, I will continue to look into other possible causes.

    Regards,

    Dan

  • Hello Dan,

    Sorry for the late reply and that I could not measure the current as suggested by you. But I have measured voltage using multimeter in two cases with coarse bits=0 in both

    1. DAC terminated by 25ohm resistance and next stage not connected- voltage = 24mV

    2. DAC terminated with 50ohm resistance and next stage i.e. trf3722 with input resistance of 50Ohm connected (lumped filter in between these stages)- voltage=48mV

    I have attached the waveform in both these cases.

    6011.Presentation1.pptx

  • Hi Sarika,

    Those voltages seem reasonable for the single ended DC bias; However, It would be helpful to see what the spectrum/waveform looked like while under these conditions. If possible, can you take a measurement from 0 - 614 MHz on a spectrum analyzer so that we can see all of the spurs? Also, can you try a lower NCO frequency, like 10 MHz and capture the waverforms again?

    Regards,

    Dan

  • Hi Dan

    Attaching the waveforms till 614MHz for both 25ohms and 50ohms cases with coarse dac as 0.

    25ohms:

    50ohms:

    I will do the excercise for NCO=10MHz and get back to you.

  • Hi Dan

    PFA for spectrum with 10MHz NCO.

    10MHz NCO.pptx

  • Hi Sarika,

    Thanks for taking the time to make these measurements! However, it seems as though the problem of high dBc spurs exists. I would like to think that we can rule out the termination being an issue, but, since you are using a custom board, it is much more difficult to fully make this conclusion. For reference, take a look at how the DAC3484 EVM outputs terminate to sma.

    Also, here is a model of the DAC3484 in TINA that emulates connection to a TRF.

    DAC3484_TRF3703_15_network_ACSOurce - autosave 17-07-26 10_24.TSC

    I will try a few more register settings here to see if I can try to rule the DAC3484 being the issue. Do you know if you will be able to get a TI DAC3484 EVM? Aside from helping to solve this issue, it may help a lot with further development of your design.

    Regards,

    Dan

  • Hi Dan

    I too think that termination is not an issue. Moreover, I am using DAC3482 in another design and it`s working perfectly fine with similar schematics.
    We have indented DAC3484EVM, but it may take some more time for us to get it in hand.
    I got little confused on looking into the output terminations used in this TINA model both on DAC side and TRF side. We have used 50ohms to ground on line of the differential path both at DAC output and trf input. You can see that on the schematic I have sent you earlier. Hope we are not doing anything wrong in that?
  • Hi Sarika,

    While it looks like your schematic (termination) should work, I can't say for certain where the problem lies. It is possible that the DAC itself may be damaged. I believe it will be much easier to resolve this issue once you have the EVM, but, until then, I'm not sure how else I can help.

    As always, please feel free to come back for help if you are having issues with the EVM.

    Regards,

    Dan
  • Hi Dan

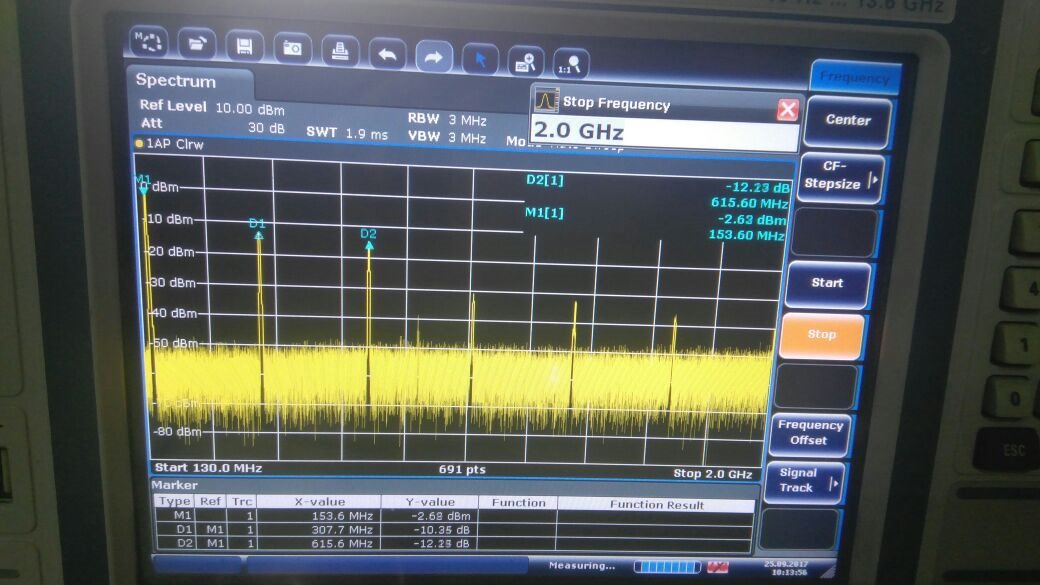
    I did DAC3484 EVM test alone (Rev H), as suggested by you earlier and as per the mail sent by Prahlad. The output seen on Spectrum analyser is:

    As you can see, the output power is very less as compared to the one posted by you (nearly 0dBm). Moreover, we are not getting second harmonic of the signal but only odd harmonics are present.

    The LED for lock detec was not going, is it because we are using external Clock?

  • Hi
    waiting for your reply.
  • Hi Sarika,

    I apologize for the delay. Are you using the DAC3484EVM in conjunction with the TSW1400? Also, I'm not sure as to exactly what your setup is (I don't have Prahlad's email). Is this using the NCO only?

    Regards,

    Dan
  • Hello Dan

    No problem.
    The test I did was as per your suggestion on Jul 20, 2017 for testing EVM alone. The only difference is I think you used rev F and I have used rev H.
    For the result I shared in the previous post, TSW was not used (as per your suggestion). GUI settings were done exactly as per the pics you shared on the post on Jul 20, 2017 .
  • Hi Sarika,

    Thanks for clarifying. I have set up the DAC3484EVM the same way as described in the email from Prahlad (DAC_CLK = 614.4MHz, NCO = 153.6MHz), but I changed the "DAC Gain" value from 0 to 10. This is located on the "Digital" tab of the GUI, and will bring the output amplitude up closer to 0 dB. Feel free to change this value as you like.

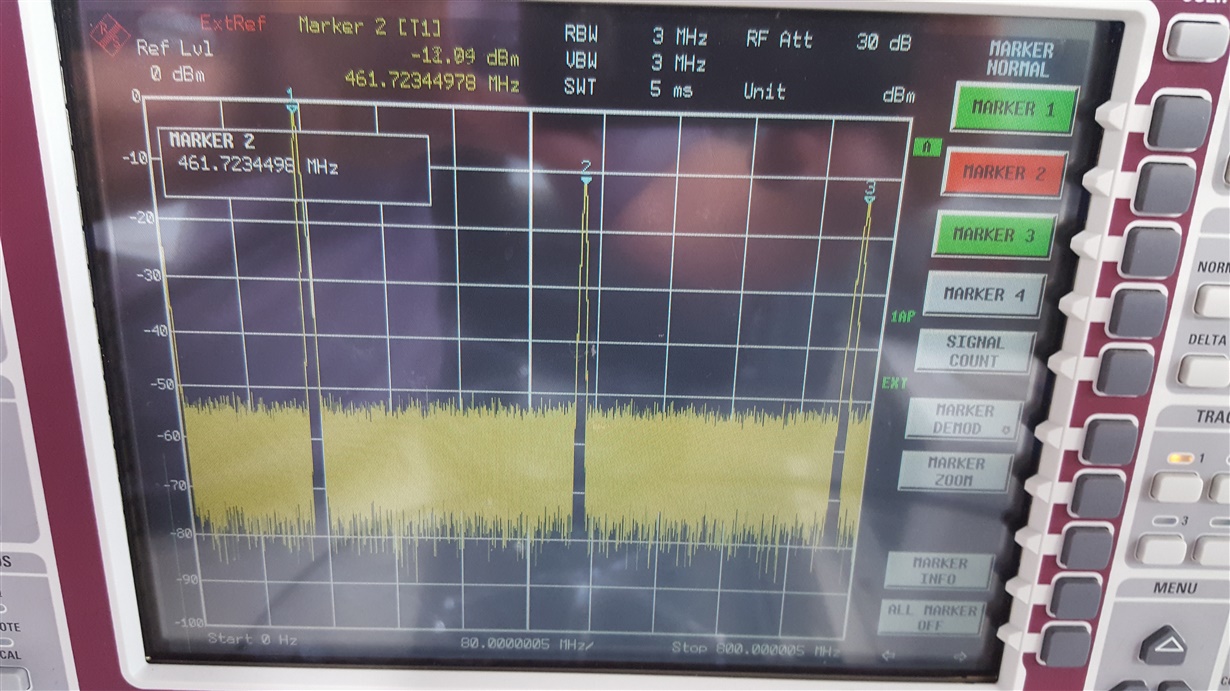
    As you can see from my output, I am not seeing that artifact at 307.34 MHz. The next artifact I see, at marker 2, is at 461MHz (Fs - Fin; 614.4 - 153.6 = 460 MHz). Beyond that is the fundamental image in the third Nyquist zone (Fs + Fin; 614.4 + 153.6 = 768 MHz). There are no harmonics present above the noise floor. The images seen here are just the product of the zero hold/sinc function of the DAC. To get rid of these, you will need to use LP or BP filtering.

    Can you please confirm that you are using 614.4 MHz for the DAC_CLK (Fs)?

    Regards,

    Dan

  • Hi Dan

    Thanks for taking out time to try this out. Yes, we used DAC_CLK=614.4 as the same was suggested in the mail and all the settings were done exactly as per the GUI images. We were reluctant to change anything to first clarify if we can replicate your results. 

    DAC gain was set to 0 and the output we obtained was -23dBm. Even if we make it 10, the output might be -13dBm. My point is, somewhere are are seeing this loss (and the even harmonics).

  • Hi Sarika,

    I appreciate your patience as we try to get this figured out. I am consulting with some of my colleagues to see if we can get to the bottom of this issue.

    If you look further out into the spectrum, are you seeing the images that I had shown in my last post (at 460MHz and 768MHz)?

    Regards,

    Dan
  • Hi again,

    Another thing you might want to look at is if these spurs are coming from an external source (like the clock or power). Are you using any filtering for the DAC clock?

    Regards,

    Dan
  • Hi Dan,

    I have tried to test the EVM as per our discussion, the gui and spectrum inages looks like this:

    I have used the same file as suggested by you. We are not seeing the signal at around 400 or 768MHz as seen by you.

    Regards,

    Sarika

  • Hi Sarika,

    Please use this file. You shouldn't need to make any adjustments to the GUI, but you may need to update the NCO frequencies if you aren't seeing an output. I have also sent this file to Prahlad.

    614.4M_1x_NoQMC_NCOonly_DAC3484.txt
       x00	   x008C
       x01	   x0100
       x02	   x8050
       x03	   xA001
       x04	   x5FF9
       x05	   xBA60
       x06	   x2A00
       x07	   xFFFF
       x08	   x0000
       x09	   x8000
       x0A	   x0000
       x0B	   x0000
       x0C	   x05A6
       x0D	   x05A6
       x0E	   x05A6
       x0F	   x05A6
       x10	   x0000
       x11	   x0000
       x12	   x0000
       x13	   x0000
       x14	   x0000
       x15	   x4000
       x16	   x0000
       x17	   x1900
       x18	   x205F
       x19	   x10F0
       x1A	   x4820
       x1B	   x0800
       x1C	   x0000
       x1D	   x0000
       x1E	   x1111
       x1F	   x8882
       x20	   x2400
       x22	   x1B1B
       x23	   x001F
       x24	   x1000
       x25	   x5A7A
       x26	   xB6B6
       x27	   xEAEA
       x28	   x4545
       x29	   x1A1A
       x2A	   x1616
       x2B	   xAAAA
       x2C	   xC4C4
       x2D	   x0005
       x2E	   x0000
       x2F	   x0000
       x30	   x0000
       x7F	   x0004
    

    I am not sure why this isn't working on your EVM, and it is also strange that these signals are the second and fourth harmonics of 153.6 MHz. Just to be certain, there is no other input to the EVM (digital data)?

    Please let me know if this issue persists even after loading this register file.

    Regards,

    Dan

  • Hello Dan,

    I tried with the file you sent. To my surprise again I am getting the same results as before and there is nothing at 461MHz or 768MHz apporx like what you are getting. Please check the markers in the attached image:

    It will be grateful if someone from TI can visit here to solve this issue, it`s been long since we are struggling. Eevn if these can be filtered at DAC output, this may create problems later on.

  • Hi Sarika,

    I was able to replicate the frequencies you are seeing. This would explain why you are not seeing the images Prahlad and I see further in the spectrum, but still have the 153.6 MHz NCO tone.

    This happens when the DACCLK is set to 460 MHz instead of 614.4 MHz. Let me know if you are able to replicate this setup, and post images of your results if possible.

    Regards,

    Dan

  • Hi Dan,

    Please check my reply dated 20th September. I have kept DACCLK as 614.4 MHz still getting even harmonics (which in calculation looks like folded back signal).
  • Hi Sarika,

    The only two ways that I am able to replicate the frequencies that you are seeing is to either reduce the DACCLK to 460 MHz (
    as I posted earlier and most closely resembles your readings), or by increasing the gain of the DAC output (amplitude of frequencies is much lower though). Using the GUI, I can increase the output amplitude to 7 dB, and, at this point, we begin to see the second harmonics creep up from the noise floor, although it is not identical to your plot.

    As we had been discussing awhile back, these harmonics become prominent when the output voltage is not properly terminated (or the output has exceeded the output pin compliance voltage), but, since we are using the DAC3484EVM, I believe we can rule out termination issues. Just to put a point on it, my picture above also contains the DAC output images that we would expect whereas your output only contains what appears to be the harmonics and not the DAC output images. As a side note, have any modifications been made to the components or hardware on the EVM?

    Could you please attempt to increase the DAC gain as highlighted in the image below? Please ensure that you load the last configuration file I provided. You may need to toggle "SIF sync" off/on. 

    This spectrum plot will be interesting to see a before and after of since it will help to determine whether the artifacts you are seeing are harmonics or DAC output images.

    Regards,

    Dan