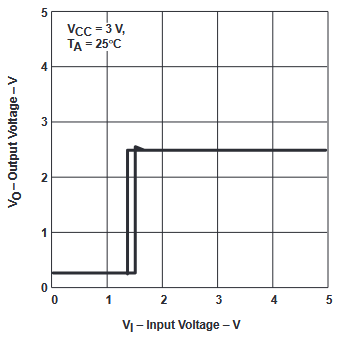
I would like to have below test graph for my SN74AUP2G04DRYR application.
I also would like to know the temperature variance of this graph. It is just enough to let me know the tolerance of the graph for -40'C~+85'C range like within 50mV????
We also try to measure this graph with SN74AUP2G04DRYR. But I am not sure our measurement is enough for all SN74AUP2G04DRYR from TI.
So it would be appreciate to send me some information that TI is used.
Best Regards,
Vincent Hwang
C:\Users\vhwang\Desktop