Other Parts Discussed in Thread: SYSCONFIG
Hi,
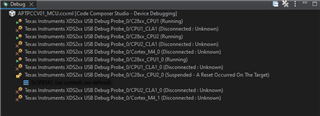
I have two TMS320F28384D in JTAG daisy chain configuration in a custom board:
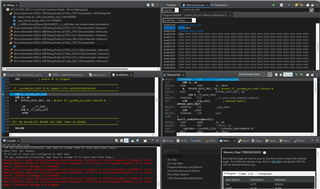
I'm using CCS 12.5.0.00007 and CWARE 5.0.0.00 with a XDS200 debug probe.
Till yesterday, I was able to program and debug both of them, in RAM or FLASH with no issue.
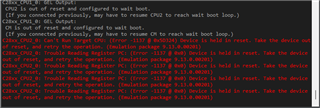
Now, I can debug in RAM in both MCUs and in all cores, but I cannot in Flash in the second MCU (considering the chain, it is called MCU1). After loading the program in Flash memory for CPU1 (the same is for CPU2) of the second MCU, I always get the error:
"C28xx_CPU1_0: Trouble Setting Breakpoint with the Action "Finish Auto Run" at 0x82985: (Error -1066 @ 0x82985) Unable to set/clear requested breakpoint. Verify that the breakpoint address is in valid memory. (Emulation package 9.13.0.00201)"
And the program is not correctly loaded.
So, if I disable the "On a program load or restart" option in "Auto Run and Launch Options" , I don't get the error and the program can be launched and it runs correctly (I say correctly because I'm using the examples "led_ex1_c28x_dual_blinky_cpu1" and "led_ex1_c28x_dual_blinky_cpu2" and I can see the blinking, but for any breakpoint I try to add, I get the error:
"C28xx_CPU1_0: Trouble Setting Breakpoint with the Action "Remain Halted" at 0x829af: (Error -1066 @ 0x829AF) Unable to set/clear requested breakpoint. Verify that the breakpoint address is in valid memory. (Emulation package 9.13.0.00201) "
and it stops, but I cannot debug code, only in Disassembly window.
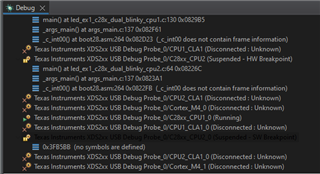
Moreover, now I get this symbol on Debug window for CPU1 of the second MCU:
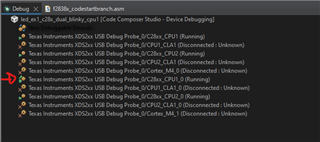
What does it mean?
I already tried some the suggestion about cleaning the workspace and the target configuration file, but even changing the workspace it does not work.
Thanks and regards,
Fabio