


Part Number: MSP432P401R
Other Parts Discussed in Thread: ENERGYTRACE
Tool/software: Code Composer Studio
Hi:
I'd like to ask you a question about debugging with energytrace.
I use the self xds110 device to connect to the MSP432 development board. The connection method is shown below.


I pulled out the development board J101 except for 5V thought all jumpers.Then use the DuPont line to connect the debugger to the development board.
debugger board
TMS --------------> TMS
TCK ---------------> TCK
TDO --------------> TDO
TDI ---------------> TDI
RST---------------> RST
3V3---------------> 3V3
I didn't use the development board's USB interface to get power from the computer. I use the emulator's 3.3V to power the development board.
After the simulator is powered on, the development board is running normally.I can find my xds110 emulator in my ccs. Verify the information below.

I started a project debugging at ccs. The debugging program can be downloaded to the development board and run.
I can use various debugging functions normally, single step, breakpoint, running, etc..
But I cannot use the enegrytrace feature.
In my CCS debug interface, the EnergyTrace button is gray, indicating that it cannot be used.Pictures are as follows.
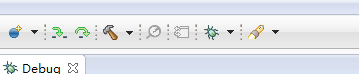
I want to know what I should do like using my emulator and using the EnergyTrace function. What should I do?
Thanks a lot!


