This thread has been locked.

If you have a related question, please click the "Ask a related question" button in the top right corner. The newly created question will be automatically linked to this question.

TM4C129ENCPDT: SRAM questions with addresses and stack

Part Number: TM4C129ENCPDT

Hi. I'm trying to wrap my head around some stuff.

1) The datasheet says that SRAM starts at 0x2000.0000 and ends at 0x2006.FFFF, but that's a lot more than 256KB that this chip is supposed to have. I'm not worried about it but is there a particular reason or something I'm not seeing?

2) The linker command file says:
        SRAM (RWX) : origin = 0x20000000, length = 0x00040000
        .vtable :   > 0x20000000
        Then I'm experimenting with the stack size, here I try a very small stack:
        __STACK_TOP = __stack + 128;
       When I debug, __stack appears to be located at 0x2001.98B8 and dereferenced it is pointing to 0x2001.9634.
       So why wouldn't it be much closer to 0x2000.0000? Shouldn't the stack come "pretty much?" right after the vector table?

3)    When the program starts, SP  =  __STACK_TOP  =  0x2001.9938, which is exactly 128 bytes (my stack size) higher than 0x2001.98B8 but I'm confused       because I thought 0x2001.98B8 was the location in memory of __stack but that the value is 0x2001.9634 and the value should be what counts.
   In my watch window it says:
   "__stack" of type int* with value 0x2001.98b8 {0x2001.9634}, no address given
   then I expand this expression and it says:
   "(x) = *(__stack)" of type int with value 0x2001.9634, and address 0x2001.98b8.
   I know this sounds very confusing but I'm thinking that the watch window is mixing up address and value.

4)    Can I set a breakpoint when a variable of my choice is written to, or changed to a certain value or is that not possible?
5)    How would I go about setting a breakpoint for when SP reaches or goes lower than __stack

FYI I'm not having stack overflow problems but I would like to understand this stuff in more detail so that I can be a good programmer :)

  • Hi,

    1. Only 256kB is implemented in this particular part number device. The 0x2000.0000 - 0x2006.FFFF is showing the maximum a device could have had. Perhaps it is a bit confusing in the datasheet.
    2. The .vtable starts at 0x20000000 and followed by .data, .bss and .system. This is probably why the .stack starts at the address you showed. To best understand how the linker allocate different sections, please read the .map file under the Debug folder along with .out and .bin.
    3. Please note that the stack counts downward not upward. It starts from 0x20019928 toward 0x200198B8.
    4. If you know the pointer address to the variable of your choice then you can setup a watchpoint that watches for that address. When that address is written then the CPU will halt. First open the Breakpoints window and then you can configure watchpoint by going to Breakpoints->Hardware Watchpoint. Specify the address you want to watch.
    5. Same as #4.
  • Thanks Charles. If you don't mind can you clarify a little further?

    1) That's not confusing, it's what I thought but wanted to make sure.

    2) If RAM is from 0x2000.0000 to 0x2003.FFFF then that means the stack has been located in the middle of ram. I'm sure there is a good reason for that. Some people seem to prefer the stack to be at/near the beginning of ram - so not sure what that's all about.
    20000000 20000000 00019938 00000000 rw-
    20000000 20000000 0001975e 00000000 rw- .bss
    20019760 20019760 00000155 00000000 rw- .data
    200198b8 200198b8 00000080 00000000 rw- .stack

    3) Right, in my case starting at 0x20019938 and can go down to... (this is where my confusion is)
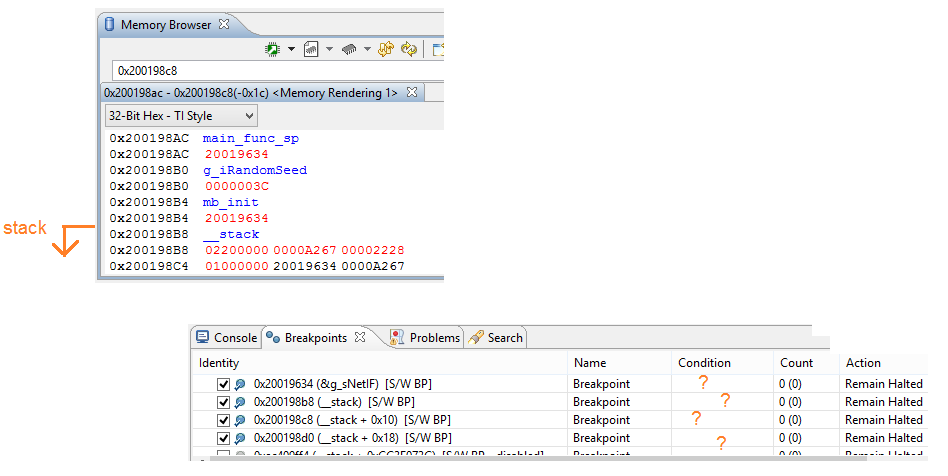
    It would make sense for the lower limit to be at 0x200198b8 (given a 0x80 stack size), however when the debugging window dereferences __stack it says it is 0x20019634. If you look at the screenshot in my first post you will know what I mean. Am I miss-reading this information?

    4) This does not seem to work for me, probably because I didn't set a condition for the breakpoint. The TI wiki barely touches on this subject btw.
    processors.wiki.ti.com/.../Watchpoint
    If you look at the screenshot on this message below, I'm showing what looks like the stack is getting completely out of bounds (this is on purpose for understanding it better). I have set several breakpoints in this region and they don't trigger.
    Also notice in the memory view how variable __stack is located at 0x2001998b8, this goes back to #2 where I have a feeling which might be wrong that __stack should be pointing to 0x2001998b8 because I thought __stack is a pointer and its value represents the bottom end of the stack.

  • Hi,

     2. Your code has the .vtable section starting at 0x20000000. Check the length of your .text section too. Do you have the load and run address for your .text section also running from SRAM? This is the reason the .stack is placed after the .text section. Pick a simple TivaWare example that does not have a .vtable mapped to the SRAM and you will find that the .stack is starting at 0x20000000. Below is an example of the hello example. The .stack starts at 0x200000000.

    SEGMENT ALLOCATION MAP

    run origin  load origin   length   init length attrs members

    ----------  ----------- ---------- ----------- ----- -------

    00000000    00000000    000014b8   000014b8    r-x

     00000000    00000000    00000200   00000200    r-- .intvecs

     00000200    00000200    00001014   00001014    r-x .text

     00001214    00001214    0000026c   0000026c    r-- .const

     00001480    00001480    00000038   00000038    r-- .cinit

    20000000    20000000    00000224   00000000    rw-

     20000000    20000000    00000200   00000000    rw- .stack

     20000200    20000200    00000020   00000000    rw- .data

     20000220    20000220    00000004   00000000    rw- .bss

    3. I don't know what are you trying to ask. To me the the value 0x0x20019634 is a value stored at address 0x200198b8. It might be a value that is stored there after you run your code or from your previous run of the program. Note that a reset does not clear the SRAM content. When you reach main() you can manually clear the content to 0 and see if it got changed after you run your code.  

    4. You are not setting a watchpoint as I suggested.

     See below images. The first image is to set a watchpoint for writing to address 0x200198b8. The second image shows how it is supposed to register in the breakpoints window after the configuration. It should say Watchpoint under the Name column.

  • Hi Charles, you've been very helpful. I wasn't able to find watchpoints but that's OK, another time and a little more research.

    Now I have a much better understanding of how the stack works on this device and I've implemented a function to write a pattern at the end of it (lowest addresses) which I will be able to monitor to ensure there is plenty of stack space.

    Thank you very much!

    extern uint32_t __STACK_TOP;
    #define STACK_SIZE 2048  //bytes
    #define STACK_GUARD 128  //bytes
    void init_stackguard(void) {
        unsigned short int i;
        uint32_t* test;
        test = &__STACK_TOP;
        test -= (STACK_SIZE / 4);
        for (i = 0; i < STACK_GUARD / 4; i++) *test++ = 0x5A5A5A5A;
    }
    

  • Hi,

     In case you are still looking to use watchpoint, below is the instruction. While your cursor is in the Breakpoints window, right-click your mouse and select Breakpoiint (Code Composer Studio)->Hardware Watchpoint.