This thread has been locked.
If you have a related question, please click the "Ask a related question" button in the top right corner. The newly created question will be automatically linked to this question.
Hi,
I am having a problem with the bq40z60 if I discharge it at a high constant current or constant power.
If I verify the gauge at a discharge current of C/5 which is the same as during the learning cycle, then all parameters like remaining discharge time and RSOC show correct values and are not far off the calculated SOC value.
If I discharge the fully charged battery with a real application current of around 6C, then it looks like this:
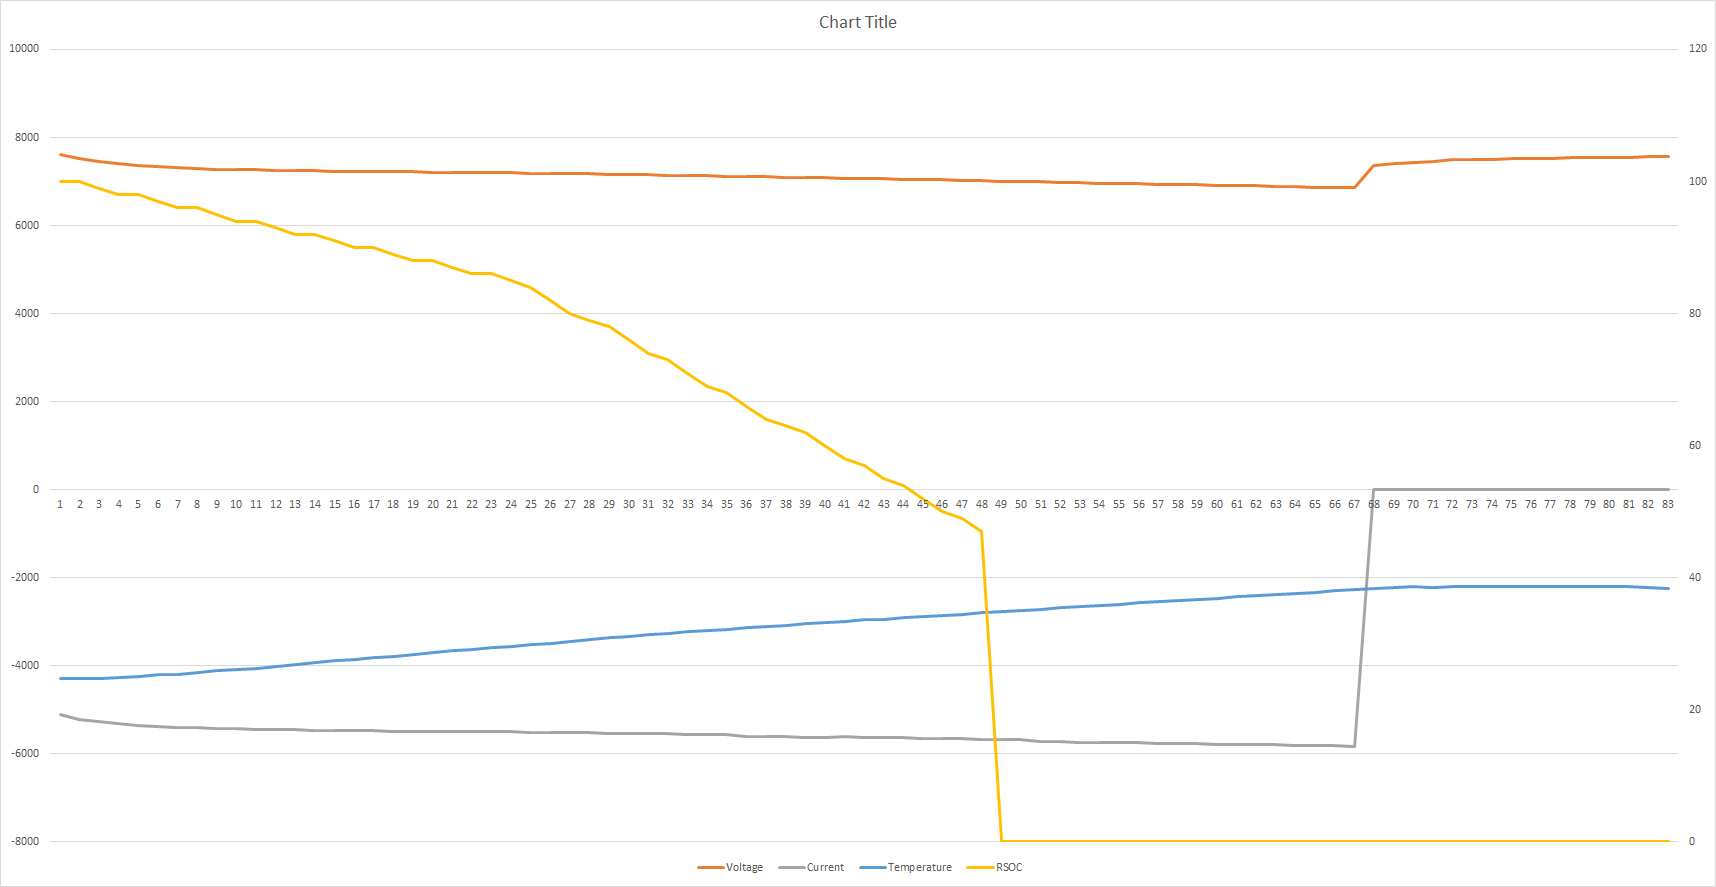
The RSOC goes from 100% to around 84%, then drops quicly to 45% from where it goes to 0%. FD and TC is set. At this point the battery is not even 50% discharged and still far away from its 6V minimum voltage. I stopped the discharge after 4.5 minutes . a full discharge to 6V would take around 11 minutes.
If I switch the gauge in constant power mode, then the results are even worse.
Could an TI expert please advise what is going wrong?
I attached the .log and .gg containing the charge and discharge cycles.
RSOC_6A.zip
Thanks,
Fred
Hi Ben,
Thank You for your suggestion. It significantly improved the accuracy. The RSOC error is now down to only 14% at the end of the discharge when the gauge shows 14% while the battery reached the end of discharge voltage. See Graph below:
Note the difference between the calculated SOC (blue) and the shown RSOC by the gauge (green). Also note that the battery was discharged at a constant power of 36W which caused the current to rise from initially -5A to -7A at the end of the discharge. I did not switch the gauge in constant power mode as this resulted in previous tests in a much worse SOC error.
How could I further improve the SOC accuracy of the gauge?
Info: The battery is in the real application discharged at a constant power between 18W and 60W depending on user configuration. The selected load is however constant during the entire discharge cycle and does not fluctuate. The Evaluation board circuits limit the discharge power to around 40W so I cannot test it at a higher power rate.
I attached the log and .gg files of the discharge test above.
Thanks,
Fred
Hi Ben,
I set LDMD=1 and set -3600cW as user rate, otherwise identical settings and conditions as in my previous post.
There is no significant change in the precision of the gauge. See gaph below and compare with my previous post:
Still the same tendency and error margin between the calculated SOC and the reported RSOC from the gauge.
I attached the logs and .gg, perhaps there is a way to make it more precise?
One of the things I see is that the gauge predicts a too long run time when the discharge starts (14 instead of ~12 Minutes) and the battery voltage quickly drops at the end of the discharge as the discharge current rises. As soon as the battery reaches its cutt-off voltage (6V), the RSOC jumps to 0% as seen in the graph.
Thanks,
Fred
Fred
What ChemID are you using? I will check your Ra table to see whether it needs to be adjusted for the high discharge rate. We had found ChemID 270 to be a marginal match earlier, but the Ra table for cells 3 and 4 do not match that ChemID.
Tom
Hi Tom,
All tests have been performed using Chem ID 3171.
Best chemical ID : 3171 Best chemical ID max. deviation, % : 3.43
I am using 2 cells in a 2S1P configuration.
I performed a new characterization cycle on new batteries and with precisely calibrated cell voltages. The result was ID 3171.
I also send in 2 cells in for characterization because of the deviation but I think there are also other configuration issues involved. The discharging rate I am using is very high which increases the temperature and resistance of the LiMn cells within minutes.
Thanks,
Fred