This thread has been locked.

If you have a related question, please click the "Ask a related question" button in the top right corner. The newly created question will be automatically linked to this question.

DRA829V: Enable cpsw0 main domain ethernet switch in u-boot

Part Number: DRA829V
Other Parts Discussed in Thread: DRA829

Hello experts,

Our custom board does not have an ethernet port on the mcu-domain, hence we cannot
use mcu_cpsw as defined in k3-j721e-mcu-wakeup.dtsi.

I have tried to add the cpsw0 stuff from the k3-j721e-evm-gesi-exp-board.dtbo, but u-boot says:

Failed to probe am65_cpsw_nuss driver
Net: No ethernet found.

Also, I have no mdio:

=> mdio list
No MDIO bus found

What I have done:

1. Added the full cpsw0: ethernet@c000000 block from linux-ti-staging into u-boot-ti-staging.

2. Added the k3-j721e-evm-gesi-exp-board.dtbo cpsw0 related things into my u-boot dts.

3. Removed all references to mcu_cpsw

Any help is appreciated.

/Bo

  • eth0: RGMII3 - phy0 in RGMII mode
    eth1: RGMII4 - phy4 in RMII mode
    eth2: RGMII1 - phy5 in RMII mode

    Bo,

    You have specified that the desired configuration is phy0 in RGMII mode and phy4, phy5 in RMII mode.
    Is this incorrect?

  • Yes, that is incorrect. I mistook the 100Mbit phys to be RMII. They are also RGMII.

  • Yes, that is incorrect. I mistook the 100Mbit phys to be RMII. They are also RGMII.

    If that's the case, please update the device-tree nodes to the following:

    &main_cpsw0_port1 {
        status = "okay";
        phy-handle = <&main_cpsw0_phy5>;
        phy-mode = "rgmii-rxid";
        mac-address = [00 00 00 00 00 00];
        phys = <&main_phy_gmii_sel 1>;
    };
    
    &main_cpsw0_port3 {
        status = "okay";
        phy-handle = <&main_cpsw0_phy0>;
        phy-mode = "rgmii-rxid";
        mac-address = [00 00 00 00 00 00];
        phys = <&main_phy_gmii_sel 3>;
    };
    
    &main_cpsw0_port4 {
        status = "okay";
        phy-handle = <&main_cpsw0_phy4>;
        phy-mode = "rgmii-rxid";
        mac-address = [00 00 00 00 00 00];
        phys = <&main_phy_gmii_sel 4>;
    };

  • Yes, I have already done that upon confirming with the hardware department.

    It doesn't change the non-functional behaviour though.

  • It doesn't change the non-functional behaviour though.

    Can you confirm whether all 3 PHYs are identical? If yes, could you confirm if the Strap Settings for the 2 PHYs whose interfaces don't work, are the same as the Strap Settings for the PHY corresponding to eth0 which works?

  • No they are not identical. As per the mdio list output, you can see that we use one DP83867 and two DP83822:

    => mdio list
    ethernet@c000000port@1:
    0 - TI DP83867 <--> ethernet@c000000port@3
    4 - TI DP83822 <--> ethernet@c000000port@4
    5 - TI DP83822 <--> ethernet@c000000port@1

  • Are the strap settings for the DP83822 PHY such that it operates in RGMII mode?
    Also, considering that the link status bit is 0, indicating that link is not detected,
    there might be other issues with the PHY configuration.

  • Are the strap settings for the DP83822 PHY such that it operates in RGMII mode?
    Also, considering that the link status bit is 0, indicating that link is not detected,
    there might be other issues with the PHY configuration.

    I will double-check this with my colleagues.

  • I will double-check this with my colleagues.

    The schematic confirms that they are strapped in RGMII mode.

    Also, when I check register 0x17, bit 9 is set, indicating RGMII mode:

    => mii read 4 0x17
    0241
    => mii read 5 0x17
    0241

    Best regards,

    /Bo

  • The schematic confirms that they are strapped in RGMII mode.

    Is it known why the link status bit remains 0?

  • Is it known why the link status bit remains 0?

    No, that is not known. Do you have any ideas?

  • Hi,

    Can you please check with your H/W team once.
    It can happen if PHY is not advertising the capabilities with Link partner, or If no connection between PHY and Link Partner as well.

    Best Regards,
    Sudheer

  • Please advice what more to check to get link and transfers working on these two DP83822 phys. I have discussed with HW team and they don't have any clues.

    Another issue has come up. The working port gets a lot of timeouts during tftp transfers. We really need tftp to work since DFU is so slow. We can't wait 90 mins for rootfs to be downloaded.

    Testing a 1MB file on Beaglebone-ai64:

    => tftpboot megfile.bin
    am65_cpsw_nuss_port ethernet@46000000port@1: K3 CPSW: rflow_id_base: 2
    link up on port 1, speed 1000, full duplex
    Using ethernet@46000000port@1 device
    TFTP from server 192.168.0.1; our IP address is 192.168.0.10
    Filename 'megfile.bin'.
    Load address: 0x82000000
    Loading: ################################################## 1 MiB
    14.1 MiB/s
    done
    Bytes transferred = 1048576 (100000 hex)

    Testing the same file on our custom board:

    => tftpboot megfile.bin
    am65_cpsw_nuss_port ethernet@c000000port@3: K3 CPSW: rflow_id_base: 16
    link up on port 3, speed 1000, full duplex
    Using ethernet@c000000port@3 device
    TFTP from server 192.168.0.1; our IP address is 192.168.0.11
    Filename 'megfile.bin'.
    Load address: 0x82000000
    Loading: T T T ##T T T #T T ####T #T ##
    Retry count exceeded; starting again

    Do you have a suggestion what can cause this? DMA- or IRQ setup perhaps?

    Best regards,

    /Bo

  • The working port gets a lot of timeouts during tftp transfers.

    Do you mean that it does work, but some times it fails as shared in the logs? Or do you mean that it never works?

    Is the interface connected directly to a TFTP server, or is there a Network Switch in between?
    If there is a Network Switch, does the Network Switch have other ports connected to it, apart from the board and the TFTP Server?
    Could you check if this issue occurs even if the TFTP server is directly connected to the board?

    Regards,
    Siddharth.

  • By "working port" I mean the GBit port that actually has link connectivity and can ping.

    With a 1Mbyte file it sometimes manages to get it through, and sometimes stops because of 10 timeouts, as above.

    I am testing on an isolated network. No other equipment. As I stated above, the beaglebone U-boot TFTP works flawlessly, and I can transfer a 240 Mbyte file in about 15 secs.

    /Bo

  • Bo,

    Could you please share the values of the following registers after TFTP times out?
    The following registers are for CPSW MAC Port 3 which is being used.
    0x0C03A610 (CPSW_STAT_RXCRCERRORS)
    0x0C03A614 (CPSW_STAT_RXCODEERRORS)
    0x0C03A618 (CPSW_STAT_RXOVERSIZEDFRAMES)
    0x0C03A628 (CPSW_STAT_ALE_DROP)
    0x0C03A628 (CPSW_STAT_ALE_OVERRUN_DROP)

    Also, could you use tcpdump, wireshark or any other packet capturing tool to determine:
    1. Whether the TFTP Server has received the packet sent by the board
    2. Whether the TFTP Server has transmitted the reply to the board

    Regards,
    Siddharth.

  • A new week! I really hope to solve the ethernet issues soon. We need it to come forward in the project.

    The above registers all show zero, so I guess there are no errors even though the transfer has several time outs:

    => tftpboot megfile.bin
    am65_cpsw_nuss_port ethernet@c000000port@3: K3 CPSW: rflow_id_base: 16
    link up on port 3, speed 1000, full duplex
    Using ethernet@c000000port@3 device
    TFTP from server 192.168.0.1; our IP address is 192.168.0.10
    Filename 'megfile.bin'.
    Load address: 0x82000000
    Loading: ##T #############T ########T ######T ######T ###T #T #T ####T #####T # 1 MiB
    19.5 KiB/s
    done
    Bytes transferred = 1048576 (100000 hex)
    =>
    => md 0x0C03A610 1
    0c03a610: 00000000 ....
    => md 0x0C03A614 1
    0c03a614: 00000000 ....
    => md 0x0C03A618 1
    0c03a618: 00000000 ....
    => md 0x0C03A628 1
    0c03a628: 00000000 ....
    => md 0x0C03A628 1
    0c03a628: 00000000 ....

    I will setup Wireshark to be able to answer your secand question.

    Best regards,

    /Bo

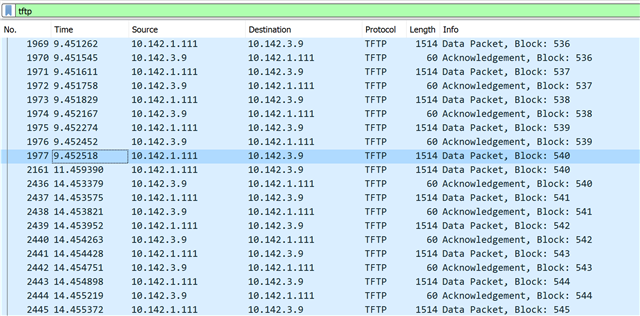
  • This is a capture from wireshark, showing a time out:

    You see that block #540 is not acknowledged directly. It is actually being resent, and
    another 3 seconds later it is acknowledged.

    This is now a TFTP server on a Windows 11 machine. The behaviour is identical with
    the TFTP server on Ubuntu.

    Best regards,

    /Bo

  • Bo,

    The TFTP server and board appear to be in different subnets, due to which I assume there is a network switch in between.
    Are other ports of the network switch connected as well, apart from the port corresponding to the TFTP server device and
    the board?

    Also, as pointed out by you in your comment, it looks like the Acknowledgement is not being sent from the board to the TFTP
    server during the timeout. Can you press "Ctrl+C" on the board to Interrupt the TFTP process, the moment you notice the TFTP
    timeout issue, followed by checking the value of the register:
    0x0C03A634 (CPSW_STAT_TXGOODFRAMES)
    to see if the number of TX packets on the board matches the number of TFTP packets expected, if the Acknowledgement
    packet were to be sent by the board?

    To determine whether the Acknowledgement packet is not being sent by the board, or it is being dropped by the network switch,
    the above process is necessary. Alternatively, if you are able to boot to Linux and use the same interface at Linux, please try TFTP
    using the same interface in Linux. If the timeout is still seen at Linux, it will be easier to debug it there. On the other hand, if the issue
    is not seen at Linux, it indicates some issue at U-Boot stage.

    Regards,
    Siddharth.

  • I issued the following:

    => md 0x0C03A634 1
    0c03a634: 00000c79 y...
    => tftpboot megfile.bin
    am65_cpsw_nuss_port ethernet@c000000port@3: K3 CPSW: rflow_id_base: 16
    link up on port 3, speed 1000, full duplex
    Using ethernet@c000000port@3 device
    TFTP from server 10.142.1.111; our IP address is 10.142.3.9
    Filename 'megfile.bin'.
    Load address: 0x82000000
    Loading: ################
    Abort
    => md 0x0C03A634 1
    0c03a634: 00000d6d m...

    The number of good transmitted packages has increased from 0x0c79 to 0x0d6d -> 244 packets. Wireshark shows that 242 TFTP packets has been received, including the initial transfer request:

    247 6.516604 10.142.3.9 10.142.1.111 TFTP 93 Read Request, File: megfile.bin, Transfer type: octet, timeout=5, tsize=0, blksize=1468
    250 6.520067 10.142.3.9 10.142.1.111 TFTP 60 Acknowledgement, Block: 0
    252 6.520533 10.142.3.9 10.142.1.111 TFTP 60 Acknowledgement, Block: 1
    254 6.520981 10.142.3.9 10.142.1.111 TFTP 60 Acknowledgement, Block: 2
    256 6.521210 10.142.3.9 10.142.1.111 TFTP 60 Acknowledgement, Block: 3

    ...

    730 6.586755 10.142.3.9 10.142.1.111 TFTP 60 Acknowledgement, Block: 237
    732 6.587003 10.142.3.9 10.142.1.111 TFTP 60 Acknowledgement, Block: 238
    734 6.587266 10.142.3.9 10.142.1.111 TFTP 60 Acknowledgement, Block: 239
    736 6.587539 10.142.3.9 10.142.1.111 TFTP 60 Acknowledgement, Block: 240

    This is where it timed out. It seems two more packets have been sent from the SoC, but they have never reached the TFTP-server. Another test showed the same, there are always 2 packets missing.

    In Linux, I don't see any TFTP traffic at all, and even ping seems shaky:

    root@asp3:/# tftp -g -r megfile.bin 10.142.1.111
    tftp: timeout
    root@asp3:/# ^C
    root@asp3:/# ping 10.142.1.111
    PING 10.142.1.111 (10.142.1.111) 56(84) bytes of data.
    64 bytes from 10.142.1.111: icmp_seq=1 ttl=128 time=1.71 ms
    64 bytes from 10.142.1.111: icmp_seq=3 ttl=128 time=2.35 ms
    64 bytes from 10.142.1.111: icmp_seq=5 ttl=128 time=1.23 ms
    64 bytes from 10.142.1.111: icmp_seq=6 ttl=128 time=1.32 ms
    64 bytes from 10.142.1.111: icmp_seq=7 ttl=128 time=2.16 ms
    64 bytes from 10.142.1.111: icmp_seq=8 ttl=128 time=2.35 ms
    64 bytes from 10.142.1.111: icmp_seq=9 ttl=128 time=2.37 ms
    64 bytes from 10.142.1.111: icmp_seq=10 ttl=128 time=2.33 ms
    64 bytes from 10.142.1.111: icmp_seq=11 ttl=128 time=2.24 ms
    ^C
    --- 10.142.1.111 ping statistics ---
    11 packets transmitted, 9 received, 18.1818% packet loss, time 10042ms
    rtt min/avg/max/mdev = 1.231/2.005/2.370/0.436 ms

    Best regards,

    /Bo

  • Bo,

    I can think of two possible reasons for the packet loss issues (Not an exhaustive list):
    1. The Network Switch is dropping them
    2. The Hardware has issues

    If it is possible to obtain the statistics of the Network Switch, that will help determine the
    exact point of packet drops. If it is possible to connect the board directly to either another
    board or the PC, please do so and check if packet drops are still being observed.

    Regards,
    Siddharth.

  • This is with a cable between PC and board:

    => tftpboot megfile.bin
    am65_cpsw_nuss_port ethernet@c000000port@3: K3 CPSW: rflow_id_base: 16
    link up on port 3, speed 1000, full duplex
    Using ethernet@c000000port@3 device
    TFTP from server 192.168.0.1; our IP address is 192.168.0.10
    Filename 'megfile.bin'.
    Load address: 0x82000000
    Loading: ############T ##T ####T #################################T ###T ###########
    ###########T ################T #T T ###T ############################
    Retry count exceeded; starting again

    Same thing, but 10 time outs so the transfer aborted. I really think it is something related to how the ethernet port has been set up. Maybe DMA or IRQ? On both BeagleBone and TI EVM in u-boot, tftp works flawlessly. This is off course with the ethernet port on the mcu domain. On those two having the switch in-between has never been a problem and the transfer of a 241 MByte file takes about 15 secs.

    I think we need to dive into dts and drivers.

    Best regards,

    /Bo

  • Bo,

    Could you please confirm and share details regarding the following?
    1. The expected PHY mode is "rgmii-rxid" in particular and not "rgmii" or another variant of it.
    2. Has the DP83867 PHY been strapped for a specific mode of operation? If yes, could you share
    details regarding the TX and RX delays configured in the PHY by reading the corresponding registers?
    3. The value of the PHY register 8.6.32 RGMII Control Register (RGMIICTL) with address 0x32 as specified in the datasheet at:
    https://www.ti.com/lit/ds/symlink/dp83867cr.pdf#page=90
    4. The value of the PHY register 8.6.38 Strap Configuration Status Register 2 (STRAP_STS2) with address 0x6F.
    5. The value of the PHY register 8.6.44 RGMII Delay Control Register (RGMIIDCTL) with address 0x86.
    6. The value of the PHY register 8.6.53 Receive Status Register (RXFSTS) with address 0x135.

    Regards,
    Siddharth.

  • Hello Siddhart,

    Yes, mode rgmii-rxid is selected, and the internal rx delay is set in the phy.

    &main_cpsw0_port3 {
    status = "okay";
    phy-handle = <&main_cpsw0_phy0>;
    phy-mode = "rgmii-rxid";
    mac-address = [00 00 00 00 00 00];
    phys = <&main_phy_gmii_sel 3>;
    };

    main_cpsw0_phy0: ethernet-phy@0 {
    reg = <0>;
    ti,rx-internal-delay = <DP83867_RGMIIDCTL_2_00_NS>;
    ti,fifo-depth = <DP83867_PHYCR_FIFO_DEPTH_4_B_NIB>;
    ti,min-output-impedance;
    };

    Register 0x32:

    => mii write 0 d 1f
    => mii write 0 e 32
    => mii write 0 d 401f
    => mii read 0 e
    00D1

    Register 0x6f:

    => mii write 0 d 1f
    => mii write 0 e 6f
    => mii write 0 d 401f
    => mii read 0 e
    0100

    Register 0x86:

    => mii write 0 d 1f
    => mii write 0 e 86
    => mii write 0 d 401f
    => mii read 0 e
    0007

    Register 0x135:

    => mii write 0 d 1f
    => mii write 0 e 135
    => mii write 0 d 401f
    => mii read 0 e
    0000

    Best regards,

    /Bo

  • Bo,

    The value of Register 0x6f is 0x0100, indicating that the value of bits 4:6 corresponding to the value of:
    STRAP_RGMII_CLK_SKEW_TX is 0.
    According to "Table 8-7. RGZ RGMII Transmit Clock Skew Details", if bits 4:6 are all 0, then it indicates
    that the RGMII TX CLOCK SKEW is set to 2.0 ns.
    Similarly, bits 0:2 of the register are 0, corresponding to the value of:
    STRAP_RGMII_CLK_SKEW_RX
    which according to "Table 8-8. RGZ RGMII Receive Clock Skew Details" indicates that RGMII RX CLOCK SKEW is set to 2.0 ns.

    Maybe the strap settings of the PHY should be fixed to match RGMII-RXID mode.

    Regards,
    Siddharth.

  • Siddhart,

    I think you're on to something! I changed register 0x32 to 0xd3 (clk delay on both rx and tx) and got significant better behavior. One transfer of the 1Mbyte file was without timeouts, and was performed in 24.4 Mbyte/s.

    I then set register 0x86 to 0x77 (2 ns delay on tx as well as rx) and tftp communication fails completely.

    I then tried to set register 0x6f to 0x0140 (2 ns rx skew, 0 ns tx skew) but that setting won't bite. Does it need to be strapped in hardware?

    Best regards,

    /Bo

  • Bo,

    The register 0x6f reflects the status of the strap configuration, which is why writing to it won't work.
    The PHY needs to be strapped in hardware as mentioned by you.

    Regards,
    Siddharth.

  • Siddhart,

    I have asked the HW team to change the strapping.

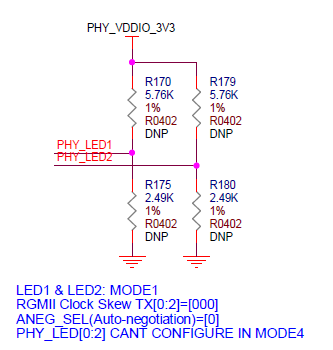
    It is a bit strange that the Beaglebone strapping is TX:[000] (2 ns skew):

    But the datasheet for the GESI expansion board says TX:0 ns and RX: 2 ns:

    Are there different skews because of the different domains (MCU, Main) that they are connected to?

    Best regards,

    /Bo

  • Bo,

    There shouldn't be a difference due to the domains. Also, I suggest keeping the strap configurations similar to
    the GESI expansion board since that matches your desired configuration.

    Regards,
    Siddharth.

  • Siddhart,

    The mod was made, but had no significant impact. Still timeouts.

    Register 0x6f now reads 0x0140.

    However, writing 0xd3 to register 0x32 shows the same improvement as above. Can this be tweaked further? Our setup has a main board and a cpu board, interconnected via a board-to-board connector, so there are hardware differences. But still, the GESI board has two board-to-board connectors on its way to the cpu SOM so I doubt that is the culprit here.

    Best regards,

    /Bo

  • Bo,

    The reason why writing 0xd3 to 0x32 works in your setup is that the
    mode being used isn't "rgmii-rxid", rather it is rgmii-id", where the PHY
    adds both TX and RX delays, which you are indicating by changing
    0xd1 to 0xd3 (Bit 1 is being set, which indicates that RGMII transmit
    clock is shifted relative to transmit data).

    rgmii-rxid: PHY adds RX delay and MAC shouldn't add RX delay.
    rgmii-id: PHY adds both RX delay and TX delay and MAC shouldn't add any delays.

    Regards,
    Siddharth.

  • Siddhart,

    Yes, I know that it is the equivalent of setting mode="rgmii-id" in the dts. The question is why it has an impact.

    With mode = "rgmii-id" and register 0x86 set to 0x27 (0.75 ns tx delay and 2ns rx delay) it seems I finally have stable communication. I will need to investigate further if this is a valid option.

    Best regards,

    /Bo

  • Siddhart,

    Update: With the HW mod in place, I have now concluded that setting the following in the DTS works for DP83867:

    &main_cpsw0_port3 {
        status = "okay";
        phy-handle = <&main_cpsw0_phy0>;
        phy-mode = "rgmii-id";
        mac-address = [00 00 00 00 00 00];
        phys = <&main_phy_gmii_sel 3>;
    };

    &main_cpsw0_mdio {
        status = "okay";
        reset-gpios = <&main_gpio0 8 GPIO_ACTIVE_LOW
            &main_gpio0 9 GPIO_ACTIVE_LOW
            &main_gpio0 10 GPIO_ACTIVE_LOW>;
        reset-delay-us = <20>;

        main_cpsw0_phy0: ethernet-phy@0 {
            reg = <0>;
            ti,rx-internal-delay = <DP83867_RGMIIDCTL_2_75_NS>;
            ti,tx-internal-delay = <DP83867_RGMIIDCTL_2_75_NS>;
            ti,fifo-depth = <DP83867_PHYCR_FIFO_DEPTH_4_B_NIB>;
            ti,min-output-impedance;
        };
    Thank you for helping out with this!

    I would really like to continue the troubleshooting of the DP83822-phys. Can we do that?

    Best regards,

    /Bo

  • I would really like to continue the troubleshooting of the DP83822-phys. Can we do that?

    Sure. Could you share the values of the following registers for either of the DP83822 PHYs when the LAN cable is connected to them?
    Link to datasheet:
    www.ti.com/.../dp83822i.pdf
    1. 0x0010 PHY Status Register (PHYSTS)
    2. 0x0011 PHY Specific Control Register (PHYSCR) 
    3. 0x0014 False Carrier Sense Counter Register
    4. 0x0015 Receive Error Count Register (RECR)
    5. 0x0017 RMII and Status Register (RCSR)
    6. 0x0019 PHY Control Register (PHYCR)

    Please share the values of the above registers after attempting to ping your PC through the interface corresponding to the DP83822 PHY.
    It is known that the ping will fail, but it will be helpful to check the registers after the ping fails.

    Regards,
    Siddharth.

  • Siddhart,

    There seems to be a major issue somewhere. Once I try to ping, the following mii or mdio read operations fails with a hard reset.

    Hit any key to stop autoboot: 0
    => mii read 4 0
    3100
    => ping 10.142.0.139
    k3-navss-ringacc ringacc@3c000000: Ring Accelerator probed rings:1024, gp-rings[440,150] sci-dev-id:211
    k3-navss-ringacc ringacc@3c000000: dma-ring-reset-quirk: disabled
    am65_cpsw_nuss_port ethernet@c000000port@3: K3 CPSW: rflow_id_base: 16
    ethernet@c000000port@3 Waiting for PHY auto negotiation to complete......... TIMEOUT !
    am65_cpsw_nuss_port ethernet@c000000port@3: phy_startup failed
    am65_cpsw_nuss_port ethernet@c000000port@3: am65_cpsw_start end error
    am65_cpsw_nuss_port ethernet@c000000port@4: K3 CPSW: rflow_id_base: 16
    ethernet@c000000port@4 Waiting for PHY auto negotiation to complete......... TIMEOUT !
    am65_cpsw_nuss_port ethernet@c000000port@4: phy_startup failed
    am65_cpsw_nuss_port ethernet@c000000port@4: am65_cpsw_start end error
    am65_cpsw_nuss_port ethernet@c000000port@1: K3 CPSW: rflow_id_base: 16
    ethernet@c000000port@1 Waiting for PHY auto negotiation to complete......... TIMEOUT !
    am65_cpsw_nuss_port ethernet@c000000port@1: phy_startup failed
    am65_cpsw_nuss_port ethernet@c000000port@1: am65_cpsw_start end error
    ping failed; host 10.142.0.139 is not alive
    => mii read 4 0x0010
    "Error" handler, esr 0xbf000000
    elr: 0000000080863310 lr : 00000000808286a4 (reloc)
    elr: 00000000fff31310 lr : 00000000ffef66a4
    x0 : 0000000000000000 x1 : 0000000000000004
    x2 : 00000000ffffffff x3 : 0000000000000010
    x4 : 00000000fff312e8 x5 : 00000000fdf05240
    x6 : 00000000fff9ccfd x7 : 00000000fdf05210
    x8 : 0000000000000000 x9 : 0000000000000008
    x10: 0000000000000010 x11: 0000000000000004
    x12: 0000000000000000 x13: 0000000000000200
    x14: 00000000fde923b0 x15: 0000000000000000
    x16: 00000000ffee72c0 x17: 0000000000000000
    x18: 00000000fdeaddb0 x19: 00000000fde92116
    x20: 0000000000000004 x21: 0000000000000010
    x22: 0000000000000004 x23: 0000000000000010
    x24: 0000000000000004 x25: 00000000fffa5442
    x26: 00000000fffa5429 x27: 00000000fffe2000
    x28: 0000000000000010 x29: 00000000fde92010

    Code: 2a0303ea 910003fd f94000e0 b9400400 (d5033fbf)
    Resetting CPU ...

    resetting ...

    Best regards,

    /Bo

  • Bo,

    If that's the case, could you share the values for the same set of registers without executing ping?

    Regards,
    Siddharth.

  • Sure,

    Here are the register values for PHY #4:

    => mii read 4 0x10
    1002
    => mii read 4 0x11
    0108
    => mii read 4 0x14
    0000
    => mii read 4 0x15
    0000
    => mii read 4 0x17
    0241
    => mii read 4 0x19
    0004

    Best regards,

    /Bo

  • In register 0x10, Bit 12 is set, indicating that Inverted Polarity is detected.
    In register 0x11, Bits 12 and 13 are 0s, indicating Normal operation mode of PHY.
    In register 0x17, Bits 11 and 12 are 0s, indicating that RGMII TX Clock Shift is enabled while RGMII RX Clock Shift is disabled. Also, Bit 9 is set indicating that RGMII mode is enabled.

    Is the physical connection 100Base-FX or 100Base-TX?
    Depending on the type of connection, the inverted polarity could cause an issue.

    Also, on a fresh boot, could you set Bit 15 of 0x001E Cable Diagnostic Control Register (CDCR)
    and report the value of the same register once Bit 1 is set, indicating completion of the diagnostic test?

    You could also try setting Bits 15 and 14 of 0x0019 PHY Control Register (PHYCR) and see if it helps.
    For Bit 15, you might have to modify the strap accordingly.

    Regards,
    Siddharth.

  • The connection is 100Base-TX.

    The cable test comes back failed:

    => mii read 4 0x1e
    0102
    => mii write 4 0x1e 0x8102
    => mii read 4 0x1e
    0103

    Setting bit 15 and 14 of reg 0x19:

    => mii read 4 0x19
    0004
    => mii write 4 0x19 0xc003
    => mii read 4 0x19
    C004

    No link still.

    Update: with another cable connected to another switch, the cable test succeeds:

    => mii write 4 0x1e 0x8000
    => mii read 4 0x1e
    0102

    registers:

    => mii read 4 0x10
    0002
    => mii read 4 0x11
    0108
    => mii read 4 0x14
    0000
    => mii read 4 0x15
    0000
    => mii read 4 0x17
    0241
    => mii read 4 0x19
    8004

    /Bo

  • Bo,

    With the new cable where the cable test succeeds, in register 0x10, bit 12 is 0 = Correct Polarity detected.
    So the cable test seems to succeed as the polarity has been fixed. Did you test pinging your PC with the new cable?
    Please test pinging your PC without modifying any registers with the new cable connected.

    Regards,
    Siddharth.

  • Siddhart,

    Yes, I tried pinging, which still fails. Which is to be expected since I have no sign of a link, neither on the LEDs or in the registers:

    => mii dump 4 1
    1. (7849) -- PHY status register --
    (8000:0000) 1.15 = 0 100BASE-T4 able
    (4000:4000) 1.14 = 1 100BASE-X full duplex able
    (2000:2000) 1.13 = 1 100BASE-X half duplex able
    (1000:1000) 1.12 = 1 10 Mbps full duplex able
    (0800:0800) 1.11 = 1 10 Mbps half duplex able
    (0400:0000) 1.10 = 0 100BASE-T2 full duplex able
    (0200:0000) 1. 9 = 0 100BASE-T2 half duplex able
    (0100:0000) 1. 8 = 0 extended status
    (0080:0000) 1. 7 = 0 (reserved)
    (0040:0040) 1. 6 = 1 MF preamble suppression
    (0020:0000) 1. 5 = 0 A/N complete
    (0010:0000) 1. 4 = 0 remote fault
    (0008:0008) 1. 3 = 1 A/N able
    (0004:0000) 1. 2 = 0 link status
    (0002:0000) 1. 1 = 0 jabber detect
    (0001:0001) 1. 0 = 1 extended capabilities


    => setenv ipaddr 192.168.0.10; setenv netmask 255.255.255.0; setenv serverip 192.168.0.1; setenv gatewayip 192.168.0.1
    => ping 192.168.0.1
    k3-navss-ringacc ringacc@3c000000: Ring Accelerator probed rings:1024, gp-rings[440,150] sci-dev-id:211
    k3-navss-ringacc ringacc@3c000000: dma-ring-reset-quirk: disabled
    am65_cpsw_nuss_port ethernet@c000000port@3: K3 CPSW: rflow_id_base: 16
    ethernet@c000000port@3 Waiting for PHY auto negotiation to complete......... TIMEOUT !
    am65_cpsw_nuss_port ethernet@c000000port@3: phy_startup failed
    am65_cpsw_nuss_port ethernet@c000000port@3: am65_cpsw_start end error
    am65_cpsw_nuss_port ethernet@c000000port@4: K3 CPSW: rflow_id_base: 16
    ethernet@c000000port@4 Waiting for PHY auto negotiation to complete......... TIMEOUT !
    am65_cpsw_nuss_port ethernet@c000000port@4: phy_startup failed
    am65_cpsw_nuss_port ethernet@c000000port@4: am65_cpsw_start end error
    am65_cpsw_nuss_port ethernet@c000000port@1: K3 CPSW: rflow_id_base: 16
    ethernet@c000000port@1 Waiting for PHY auto negotiation to complete......... TIMEOUT !
    am65_cpsw_nuss_port ethernet@c000000port@1: phy_startup failed
    am65_cpsw_nuss_port ethernet@c000000port@1: am65_cpsw_start end error
    ping failed; host 192.168.0.1 is not alive

    Best regards,

    /Bo

  • Bo,

    Can you try setting Bit 15 of 0x001F PHY Reset Control Register (PHYRCR)
    and check if the link status bit is set and the link is detected?

    Also, can you please share the details of the exact strap configurations chosen for each table:
    Table 8-10. 4-Level Strap Pins
    Table 8-11. Modes of Operation
    Table 8-13. MAC Interface Configuration
    The above tables are present on page 49 of the datasheet:
    https://www.ti.com/lit/ds/symlink/dp83822i.pdf#page=49

    Regards,
    Siddharth.

  • Siddhart,

    These are the strappings:

    COL: Mode 1
    RX_D0: Mode 1
    RX_D1: Mode 4
    RX_D2: Mode 1
    RX_D3: Mode 1
    LED_0: Mode 4
    LED_1: Mode 1
    CRS: Mode 2
    RX_ER: Mode 2
    RX_DV: Mode 1

    So, FX_EN=0, AN_EN=1, AN_1=1, AN_0=1

    From these I recon that we are advertising 10BASE-Te, Half/Full-Duplex and 100BASE-TX, Half/Full-Duplex.

    And RGMII_EN=1, RMII_EN=0, XI_50=0

    which means MAC Interface config = RGMII, 25-MHz Reference clock (yes, we have 25MHz crystal).

    Best regards,

    /Bo

  • Bo,

    Thank you for the details. Could you please confirm that the strap Resistor and Voltage Ratios follow the recommendations in:
    Table 8-8. Recommended 4-Level Strap Resistor Ratios
    Table 8-9. 4-Level Strap Voltage Ratios

    The link not being detected is weird and could have something to do with the strap configuration ending up in an inconsistent state.
    If possible, please measure the strap pins on the board to ensure that the voltages indicate the correct state (0 / 1).

    Regards,
    Siddharth.

  • Siddhart,

    The resistor values corresponds to the values in the datasheet.

    How can I measure the values? Oscilloscope during start-up? Aren't these voltages only valid very briefly?

    Best regards,

    /Bo

  • Bo,

    It is sufficient to measure the Voltage being generated with the combination of RH and RL,
    ensuring that the values are within the specified range for each of the modes, mentioned in
    Table 8-9. 4-Level Strap Voltage Ratios in the datasheet.

    Edit: To clarify, for a selected VDDIO, please ensure that the Voltage generated by the Voltage
    Divider circuit is within Vmin and Vmax as specified in the table.

    Regards,
    Siddharth.

  • Siddhart,

    I try to measure these, but they are all 0V! I'll need to get some help from the HW team.

    Best regards,

    /Bo

  • Siddhart,

    Some more info:

    When I force the port to 10 MBit I get the activity on the link led, and link status = 1 in register 0x0001.

    We see quite a bit of randomness between different combinations of main boards (with phys) and cpu boards (with the SoC).

    Best regards,

    /Bo

  • Hi,

    Can you read/dump the following RGMII status registers.
    RGMII1_STATUS_REG (0x0C000030h)
    RGMII3_STATUS_REG (0x0C000038h)
    RGMII4_STATUS_REG (0x0C00003Ch)

    Also, following ENET_CTRL registers 
    ENET1_CTRL (00104044h)
    ENET3_CTRL (0010404Ch)
    ENET4_CTRL (00104050h)

    Can you please confirm, crystal connected to PHY XI & XO is 25MHz or not?
    Also, dump the PHY Basic registers BMCR, BMSR, ANAR, ANLPAR, ANER, and control registers.

    Best Regards,
    Sudheer

  • Update.

    I have made a huge mistake with our Yocto build system. The files tiboot3.bin and sysfw.itb are not updated when I run a build for u-boot. My command for rebuilding looks like this (asp3 is our machine type):

    $ MACHINE=asp3 bitbake virtual/bootloader

    To get freshly builds of tiboot3.bin and sysfw.itb you need to run:

    $ MACHINE=asp3-k3r5 bitbake virtual/bootloader

    And to get them assembled in to final deploy folder:

    $ MACHINE=asp3 bitbake core-image-minimal

    I now have working link and autonegotiation on all my three ports, but I can't ping or tftp on the 100Mbit ports.

    The dts looks like this now. I am unsure about how to configure the DP83822:s.

    &main_cpsw0 {
        status = "okay";
        pinctrl-names = "default";
        pinctrl-0 = <&main_cpsw0_mdio_pins_default>,
                <&rgmii3_pins_default>,
                <&rgmii4_pins_default>,
                <&rgmii1_pins_default>;
    };

    &main_cpsw0_port3 {
        status = "okay";
        phy-handle = <&main_cpsw0_phy0>;
        phy-mode = "rgmii-id";
        mac-address = [00 00 00 00 00 00];
        phys = <&main_phy_gmii_sel 3>;
    };

    &main_cpsw0_port4 {
        status = "okay";
        phy-handle = <&main_cpsw0_phy4>;
        phy-mode = "rgmii-id";
        mac-address = [00 00 00 00 00 00];
        phys = <&main_phy_gmii_sel 4>;
    };

    &main_cpsw0_port1 {
        status = "okay";
        phy-handle = <&main_cpsw0_phy5>;
        phy-mode = "rgmii-id";
        mac-address = [00 00 00 00 00 00];
        phys = <&main_phy_gmii_sel 1>;
    };

    &main_cpsw0_mdio {
        status = "okay";
        reset-gpios = <&main_gpio0 8 GPIO_ACTIVE_LOW
            &main_gpio0 9 GPIO_ACTIVE_LOW
            &main_gpio0 10 GPIO_ACTIVE_LOW>;
        reset-delay-us = <20>;

        main_cpsw0_phy0: ethernet-phy@0 {
            reg = <0>;
            ti,rx-internal-delay = <DP83867_RGMIIDCTL_2_75_NS>;
            ti,tx-internal-delay = <DP83867_RGMIIDCTL_2_75_NS>;
            ti,fifo-depth = <DP83867_PHYCR_FIFO_DEPTH_4_B_NIB>;
            ti,min-output-impedance;
        };

        main_cpsw0_phy4: ethernet-phy@4 {
            reg = <4>;
            compatible = "ti,dp83822", "ethernet-phy-ieee802.3-c22";
            rx-internal-delay-ps = <3500>;
            tx-internal-delay-ps = <3500>;
        };

        main_cpsw0_phy5: ethernet-phy@5 {
            reg = <5>;
            compatible = "ti,dp83822", "ethernet-phy-ieee802.3-c22";
            rx-internal-delay-ps = <3500>;
            tx-internal-delay-ps = <3500>;
        };
    };
    Best regards,
    /Bo