Tool/software:
Hi Doredla Sudheer Kumar,
Just created this new thread to discuss on the communication issue in LRE mode.
The below is the thread we discussed on the Broadcom in LRE mode,
https://e2e.ti.com/support/processors-group/processors/f/processors-forum/1446512/processor-sdk-j784s4-not-able-to-get-dynamic-ip-when-dhcp-is-enabled/5628789#5628789
The below is the thread we discussed on the Broadcom in IEEE mode for 1000Mbps,
I have tried in LRE mode for forced 100 and loopback enabled whether the packets are looping back or not like how I did in the old hardware with all the driver changes I have discussed in the old thread, I have tried in the new hardware. Because we suscepted last time there could be hardware issue right? To confirm whether we are gettting the same behaviour or not. The same behaviour is happening here also. The communication is not happenning. If the same hardware is working in IEEE means, it needs to work in LRE mode also right?
The test results,
First case: forced 100, loopback enabled from the driver and connecte to the router
root@j784s4-evm:/opt/edgeai-gst-apps# ethtool eth1
Settings for eth1:
	Supported ports: [ TP	 MII ]
	Supported link modes:   10baseT/Half 10baseT/Full
	                        100baseT/Half
	Supported pause frame use: Symmetric
	Supports auto-negotiation: Yes
	Supported FEC modes: Not reported
	Advertised link modes:  10baseT/Half 10baseT/Full
	                        100baseT/Half
	Advertised pause frame use: Symmetric
	Advertised auto-negotiation: Yes
	Advertised FEC modes: Not reported
	Speed: 100Mb/s
	Duplex: Full
	Auto-negotiation: off
	master-slave cfg: forced slave
	master-slave status: slave
	Port: Twisted Pair
	PHYAD: 0
	Transceiver: external
	MDI-X: off (forced)
	Supports Wake-on: d
	Wake-on: d
        Current message level: 0x000020f7 (8439)
                               drv probe link ifdown ifup rx_err tx_err hw
	Link detected: yes
root@j784s4-evm:/opt/edgeai-gst-apps# phytool read eth1/0x00/0x00
0x4200
I believe below is the one register to confirm whether it is IEEE mode or in LRE mode. Is that correct?
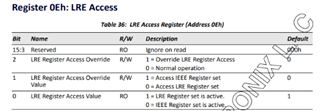
root@j784s4-evm:/opt/edgeai-gst-apps# phytool read eth1/0x00/0x0E
0x0001
root@j784s4-evm:/opt/edgeai-gst-apps# phytool read eth1/0x00/0x18
0x71e7
root@j784s4-evm:/opt/edgeai-gst-apps# devmem2 0x00104034
/dev/mem opened.
Memory mapped at address 0xffff98253000.
Read at address  0x00104034 (0xffff98253034): 0x00000002
root@j784s4-evm:/opt/edgeai-gst-apps# ethtool -S eth1 | grep "broadcast_frames"
     p0_rx_broadcast_frames: 249
     p0_tx_broadcast_frames: 0
     rx_broadcast_frames: 0
     tx_broadcast_frames: 249
root@j784s4-evm:/opt/edgeai-gst-apps# ping -c 192.168.0.6
ping: invalid number '192.168.0.6'
root@j784s4-evm:/opt/edgeai-gst-apps# ping 192.168.0.6
PING 192.168.0.6 (192.168.0.6): 56 data bytes
^C
--- 192.168.0.6 ping statistics ---
5 packets transmitted, 0 packets received, 100% packet loss
root@j784s4-evm:/opt/edgeai-gst-apps# ethtool -S eth1 | grep "broadcast_frames"
     p0_rx_broadcast_frames: 325
     p0_tx_broadcast_frames: 0
     rx_broadcast_frames: 0
     tx_broadcast_frames: 325

Second case: Did software reset, speed automatically changed to 10M and link is not detected and enabled loopback and link detected and got tx carrier sense errors.
root@j784s4-evm:/opt/edgeai-gst-apps# phytool write eth1/0x00/0x00 0x8000
root@j784s4-evm:/opt/edgeai-gst-apps# [  578.051705] Phy is not in running state! and the state of the phy is 5
[  578.058453] am65-cpsw-nuss c200000.ethernet eth1: Link is Down

root@j784s4-evm:/opt/edgeai-gst-apps# ifconfig
eth1: flags=4099<UP,BROADCAST,MULTICAST>  mtu 1500
        inet6 fe80::38a2:52ff:fe14:e172  prefixlen 64  scopeid 0x20<link>
        ether 3a:a2:52:14:e1:72  txqueuelen 1000  (Ethernet)
        RX packets 0  bytes 0 (0.0 B)
        RX errors 0  dropped 0  overruns 0  frame 0
        TX packets 533  bytes 27646 (26.9 KiB)
        TX errors 0  dropped 0 overruns 0  carrier 0  collisions 0

lo: flags=73<UP,LOOPBACK,RUNNING>  mtu 65536
        inet 127.0.0.1  netmask 255.0.0.0
        inet6 ::1  prefixlen 128  scopeid 0x10<host>
        loop  txqueuelen 1000  (Local Loopback)
        RX packets 571  bytes 49836 (48.6 KiB)
        RX errors 0  dropped 0  overruns 0  frame 0
        TX packets 571  bytes 49836 (48.6 KiB)
        TX errors 0  dropped 0 overruns 0  carrier 0  collisions 0

root@j784s4-evm:/opt/edgeai-gst-apps# ethtool eth1
Settings for eth1:
	Supported ports: [ TP	 MII ]
	Supported link modes:   10baseT/Half 10baseT/Full
	                        100baseT/Half
	Supported pause frame use: Symmetric
	Supports auto-negotiation: Yes
	Supported FEC modes: Not reported
	Advertised link modes:  10baseT/Half 10baseT/Full
	                        100baseT/Half
	Advertised pause frame use: Symmetric
	Advertised auto-negotiation: Yes
	Advertised FEC modes: Not reported
	Speed: 10Mb/s
	Duplex: Full
	Auto-negotiation: off
	master-slave cfg: forced slave
	master-slave status: slave
	Port: Twisted Pair
	PHYAD: 0
	Transceiver: external
	MDI-X: off (forced)
	Supports Wake-on: d
	Wake-on: d
        Current message level: 0x000020f7 (8439)
                               drv probe link ifdown ifup rx_err tx_err hw
	Link detected: no
root@j784s4-evm:/opt/edgeai-gst-apps# phytool write eth1/0x00/0x00 0x4000
root@j784s4-evm:/opt/edgeai-gst-apps# [  615.939702] Automatic power-down is not enabled!
[  615.944333] am65-cpsw-nuss c200000.ethernet: am65_cpsw_nuss_mac_link_up
[  615.950942] am65-cpsw-nuss c200000.ethernet: am65_cpsw_nuss_mac_link_up Link Up: Speed=10, Duplex=1, tx_pause=0, rx_pause=0, mode=0, interface=11
[  615.964084] am65-cpsw-nuss c200000.ethernet eth1: Link is Up - 10Mbps/Full - flow control off

root@j784s4-evm:/opt/edgeai-gst-apps# ethtool eth1
Settings for eth1:
	Supported ports: [ TP	 MII ]
	Supported link modes:   10baseT/Half 10baseT/Full
	                        100baseT/Half
	Supported pause frame use: Symmetric
	Supports auto-negotiation: Yes
	Supported FEC modes: Not reported
	Advertised link modes:  10baseT/Half 10baseT/Full
	                        100baseT/Half
	Advertised pause frame use: Symmetric
	Advertised auto-negotiation: Yes
	Advertised FEC modes: Not reported
	Speed: 10Mb/s
	Duplex: Full
	Auto-negotiation: off
	master-slave cfg: forced slave
	master-slave status: slave
	Port: Twisted Pair
	PHYAD: 0
	Transceiver: external
	MDI-X: off (forced)
	Supports Wake-on: d
	Wake-on: d
        Current message level: 0x000020f7 (8439)
                               drv probe link ifdown ifup rx_err tx_err hw
	Link detected: yes
root@j784s4-evm:/opt/edgeai-gst-apps# ifconfig
eth1: flags=4163<UP,BROADCAST,RUNNING,MULTICAST>  mtu 1500
        inet6 fe80::38a2:52ff:fe14:e172  prefixlen 64  scopeid 0x20<link>
        ether 3a:a2:52:14:e1:72  txqueuelen 1000  (Ethernet)
        RX packets 0  bytes 0 (0.0 B)
        RX errors 0  dropped 0  overruns 0  frame 0
        TX packets 544  bytes 29388 (28.6 KiB)
        TX errors 0  dropped 0 overruns 0  carrier 0  collisions 0

lo: flags=73<UP,LOOPBACK,RUNNING>  mtu 65536
        inet 127.0.0.1  netmask 255.0.0.0
        inet6 ::1  prefixlen 128  scopeid 0x10<host>
        loop  txqueuelen 1000  (Local Loopback)
        RX packets 571  bytes 49836 (48.6 KiB)
        RX errors 0  dropped 0  overruns 0  frame 0
        TX packets 571  bytes 49836 (48.6 KiB)
        TX errors 0  dropped 0 overruns 0  carrier 0  collisions 0

root@j784s4-evm:/opt/edgeai-gst-apps# ethtool -S eth1 | grep "broadcast_frames"
root@j784s4-evm:/opt/edgeai-gst-apps# ethtool -S eth1 | grep "broadcast_frames"
root@j784s4-evm:/opt/edgeai-gst-apps# devmem2 0x00104034
/dev/mem opened.
Memory mapped at address 0xffff922ca000.
Read at address  0x00104034 (0xffff922ca034): 0x00000002
root@j784s4-evm:/opt/edgeai-gst-apps# phytool read eth1/0x00/0x0E
0x0001
root@j784s4-evm:/opt/edgeai-gst-apps# ethtool -S eth1 | grep "broadcast_frames"
root@j784s4-evm:/opt/edgeai-gst-apps# vi /etc/systemd/network/10-eth.network
root@j784s4-evm:/opt/edgeai-gst-apps# sudo systemctl restart systemd-networkd
root@j784s4-evm:/opt/edgeai-gst-apps# ifconfig
eth1: flags=4163<UP,BROADCAST,RUNNING,MULTICAST>  mtu 1500
        inet 192.168.0.10  netmask 255.255.255.0  broadcast 192.168.0.255
        inet6 fe80::38a2:52ff:fe14:e172  prefixlen 64  scopeid 0x20<link>
        ether 3a:a2:52:14:e1:72  txqueuelen 1000  (Ethernet)
        RX packets 0  bytes 0 (0.0 B)
        RX errors 0  dropped 0  overruns 0  frame 0
        TX packets 562  bytes 32159 (31.4 KiB)
        TX errors 0  dropped 0 overruns 0  carrier 0  collisions 0

lo: flags=73<UP,LOOPBACK,RUNNING>  mtu 65536
        inet 127.0.0.1  netmask 255.0.0.0
        inet6 ::1  prefixlen 128  scopeid 0x10<host>
        loop  txqueuelen 1000  (Local Loopback)
        RX packets 571  bytes 49836 (48.6 KiB)
        RX errors 0  dropped 0  overruns 0  frame 0
        TX packets 571  bytes 49836 (48.6 KiB)
        TX errors 0  dropped 0 overruns 0  carrier 0  collisions 0

root@j784s4-evm:/opt/edgeai-gst-apps# phytool read eth1/0x00/0x18
0x0400
root@j784s4-evm:/opt/edgeai-gst-apps# ethtool -S eth1 | grep "broadcast_frames"
root@j784s4-evm:/opt/edgeai-gst-apps# ping 192.168.0.6
PING 192.168.0.6 (192.168.0.6): 56 data bytes
^C
--- 192.168.0.6 ping statistics ---
2 packets transmitted, 0 packets received, 100% packet loss
root@j784s4-evm:/opt/edgeai-gst-apps# ethtool -S eth1 | grep "broadcast_frames"
     p0_rx_broadcast_frames: 555
     p0_tx_broadcast_frames: 0
     rx_broadcast_frames: 0
     tx_broadcast_frames: 487
root@j784s4-evm:/opt/edgeai-gst-apps# etht[  750.086636] systemd-journald[203]: Data hash table of /run/log/journal/9e2aae7727004003884f7c6d629bf008/system.journal has a fill level at 75.0 (10923 of 14563 items, 8388608 file size, 767 bytes per hash table item), suggesting rotation.
[  750.107738] systemd-journald[203]: /run/log/journal/9e2aae7727004003884f7c6d629bf008/system.journal: Journal header limits reached or header out-of-date, rotating.
ool -S eth1
NIC statistics:
     p0_rx_good_frames: 637
     p0_rx_broadcast_frames: 562
     p0_rx_multicast_frames: 75
     p0_rx_crc_errors: 0
     p0_rx_oversized_frames: 0
     p0_rx_undersized_frames: 0
     p0_ale_drop: 0
     p0_ale_overrun_drop: 0
     p0_rx_octets: 48104
     p0_tx_good_frames: 0
     p0_tx_broadcast_frames: 0
     p0_tx_multicast_frames: 0
     p0_tx_octets: 0
     p0_tx_64B_frames: 555
     p0_tx_65_to_127B_frames: 47
     p0_tx_128_to_255B_frames: 18
     p0_tx_256_to_511B_frames: 17
     p0_tx_512_to_1023B_frames: 0
     p0_tx_1024B_frames: 0
     p0_net_octets: 48104
     p0_rx_bottom_fifo_drop: 0
     p0_rx_port_mask_drop: 0
     p0_rx_top_fifo_drop: 0
     p0_ale_rate_limit_drop: 0
     p0_ale_vid_ingress_drop: 0
     p0_ale_da_eq_sa_drop: 0
     p0_ale_block_drop: 0
     p0_ale_secure_drop: 0
     p0_ale_auth_drop: 0
     p0_ale_unknown_ucast: 0
     p0_ale_unknown_ucast_bytes: 0
     p0_ale_unknown_mcast: 0
     p0_ale_unknown_mcast_bytes: 0
     p0_ale_unknown_bcast: 0
     p0_ale_unknown_bcast_bytes: 0
     p0_ale_pol_match: 0
     p0_ale_pol_match_red: 0
     p0_ale_pol_match_yellow: 0
     p0_ale_mcast_sa_drop: 0
     p0_ale_dual_vlan_drop: 0
     p0_ale_len_err_drop: 0
     p0_ale_ip_next_hdr_drop: 0
     p0_ale_ipv4_frag_drop: 0
     p0_tx_mem_protect_err: 0
     p0_tx_pri0: 0
     p0_tx_pri1: 0
     p0_tx_pri2: 0
     p0_tx_pri3: 0
     p0_tx_pri4: 0
     p0_tx_pri5: 0
     p0_tx_pri6: 0
     p0_tx_pri7: 0
     p0_tx_pri0_bcnt: 0
     p0_tx_pri1_bcnt: 0
     p0_tx_pri2_bcnt: 0
     p0_tx_pri3_bcnt: 0
     p0_tx_pri4_bcnt: 0
     p0_tx_pri5_bcnt: 0
     p0_tx_pri6_bcnt: 0
     p0_tx_pri7_bcnt: 0
     p0_tx_pri0_drop: 0
     p0_tx_pri1_drop: 0
     p0_tx_pri2_drop: 0
     p0_tx_pri3_drop: 0
     p0_tx_pri4_drop: 0
     p0_tx_pri5_drop: 0
     p0_tx_pri6_drop: 0
     p0_tx_pri7_drop: 0
     p0_tx_pri0_drop_bcnt: 0
     p0_tx_pri1_drop_bcnt: 0
     p0_tx_pri2_drop_bcnt: 0
     p0_tx_pri3_drop_bcnt: 0
     p0_tx_pri4_drop_bcnt: 0
     p0_tx_pri5_drop_bcnt: 0
     p0_tx_pri6_drop_bcnt: 0
     p0_tx_pri7_drop_bcnt: 0
     rx_good_frames: 0
     rx_broadcast_frames: 0
     rx_multicast_frames: 0
     rx_pause_frames: 0
     rx_crc_errors: 0
     rx_align_code_errors: 0
     rx_oversized_frames: 0
     rx_jabber_frames: 0
     rx_undersized_frames: 0
     rx_fragments: 0
     ale_drop: 0
     ale_overrun_drop: 0
     rx_octets: 0
     tx_good_frames: 533
     tx_broadcast_frames: 487
     tx_multicast_frames: 46
     tx_pause_frames: 0
     tx_deferred_frames: 0
     tx_collision_frames: 0
     tx_single_coll_frames: 0
     tx_mult_coll_frames: 0
     tx_excessive_collisions: 0
     tx_late_collisions: 0
     rx_ipg_error: 0
     tx_carrier_sense_errors: 104
     tx_octets: 38460
     tx_64B_frames: 485
     tx_65_to_127B_frames: 27
     tx_128_to_255B_frames: 12
     tx_256_to_511B_frames: 9
     tx_512_to_1023B_frames: 0
     tx_1024B_frames: 0
     net_octets: 39188
     rx_bottom_fifo_drop: 0
     rx_port_mask_drop: 0
     rx_top_fifo_drop: 0
     ale_rate_limit_drop: 0
     ale_vid_ingress_drop: 0
     ale_da_eq_sa_drop: 0
     ale_block_drop: 0
     ale_secure_drop: 0
     ale_auth_drop: 0
     ale_unknown_ucast: 0
     ale_unknown_ucast_bytes: 0
     ale_unknown_mcast: 0
     ale_unknown_mcast_bytes: 0
     ale_unknown_bcast: 0
     ale_unknown_bcast_bytes: 0
     ale_pol_match: 0
     ale_pol_match_red: 0
     ale_pol_match_yellow: 0
     ale_mcast_sa_drop: 0
     ale_dual_vlan_drop: 0
     ale_len_err_drop: 0
     ale_ip_next_hdr_drop: 0
     ale_ipv4_frag_drop: 0
     iet_rx_assembly_err: 0
     iet_rx_assembly_ok: 0
     iet_rx_smd_err: 0
     iet_rx_frag: 0
     iet_tx_hold: 0
     iet_tx_frag: 0
     tx_mem_protect_err: 0
     tx_pri0: 637
     tx_pri1: 0
     tx_pri2: 0
     tx_pri3: 0
     tx_pri4: 0
     tx_pri5: 0
     tx_pri6: 0
     tx_pri7: 0
     tx_pri0_bcnt: 48104
     tx_pri1_bcnt: 0
     tx_pri2_bcnt: 0
     tx_pri3_bcnt: 0
     tx_pri4_bcnt: 0
     tx_pri5_bcnt: 0
     tx_pri6_bcnt: 0
     tx_pri7_bcnt: 0
     tx_pri0_drop: 0
     tx_pri1_drop: 0
     tx_pri2_drop: 0
     tx_pri3_drop: 0
     tx_pri4_drop: 0
     tx_pri5_drop: 0
     tx_pri6_drop: 0
     tx_pri7_drop: 0
     tx_pri0_drop_bcnt: 0
     tx_pri1_drop_bcnt: 0
     tx_pri2_drop_bcnt: 0
     tx_pri3_drop_bcnt: 0
     tx_pri4_drop_bcnt: 0
     tx_pri5_drop_bcnt: 0
     tx_pri6_drop_bcnt: 0
     tx_pri7_drop_bcnt: 0
root@j784s4-evm:/opt/edgeai-gst-apps#


Third case: The code I used for IEE mode, just modified the below one change alone.
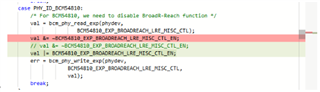
Link detected, ping test was working. But to confirm whether it was in LRE mode or not, we read the below register. The LRE register set was not configured. It was in IEEE mode only.
root@j784s4-evm:/opt/edgeai-gst-apps# phytool read eth1/0x00/0x0E
0x0000

I am not sure how we can confirm the LRE mode and how we can achieve communication establishment in LRE mode.
Could you please give thoughts and inputs on this?
Thanks in advance,
Swedha R