Hello, everyone.
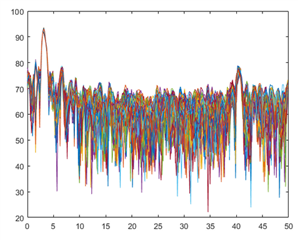
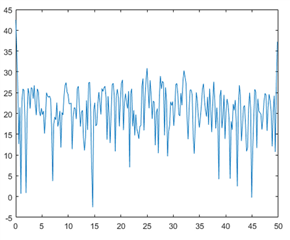
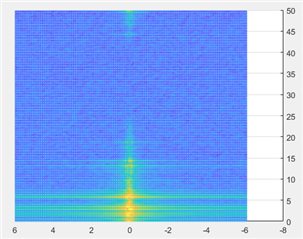
I'm using AWR2243BOOST and DCA 1000EVM for data capture. I want to use mmWaveLink_SingleChip_Example to capture data without using mmwavestudio. After gathering the data, I plot 2DFFT. But the figure exsits obvious doppler expansion. Everything in the testing experionment is stationary, so it seems that Doppler diffusion should not be present. I don't know what's wrong.
The plot is shown below:
Here is my mmwaveconfig.txt:
#
#For detailed view of mmWave Radar configuration structure
#please refer
#ti\control\mmwavelink\docs\doxygen\html\index.html
#

#
#Global configuration
#Advanced frame test enable/disable; 1 - Advanced frame; 0 - Legacy frame
#Continuous mode test enable/disable; 1 - Enable; 0 - Disable
#Dynamic chirp test enable/disable; 1 - Enable; 0 - Disable; This should not be enabled if Advanced chirp test is enabled
#Dynamic profile test enable/disable; 1 - Enable; 0 - Disable
#Advanced chirp test enable/disable; 1 - Enable; 0 - Disable; The legacy chirp API is not required if this is enabled
#Firmware download enable/disable; 1 - Enable; 0 - Disable
#mmWaveLink logging enable/disable; 1 - Enable; 0 - Disable
#Calibration enable/disable; To perform calibration store/restore; 1 - Enable; 0 - Disable
#Calibration Store/Restore; If CalibEnable = 1, then whether to store/restore; 1 - Store; 0 - Restore
#Transport mode; 1 - I2C; 0 - SPI
#Flash connected enable/disable; 1 - Enable; 0 - Disable
#
LinkAdvanceFrameTest=0;
LinkContModeTest=0;
LinkDynChirpTest=1;
LinkDynProfileTest=0;
LinkAdvChirpTest=0;
EnableFwDownload=1;
EnableMmwlLogging=0;
CalibEnable=0;
CalibStoreRestore=1;
TransferMode=0;
IsFlashConnected=1;
#END

#
#power on master arguments, please modify if needed.
#rlClientCbs_t: crcType 0:16Bit/1:32Bit/2:64Bit, ackTimeout
#
crcType=1;
ackTimeout=1000;
#END

#
#channel config parameters, please modify if needed.
#rlChanCfg_t
#
channelTx=3;
channelRx=15;
cascading=0;
#END

#
#ADC out config parameters, please modify if needed.
#rlAdcOutCfg_t
#
adcBits=2;
adcFormat=2;
#END

#
#DATA format config parameters, please modify if needed.
#rlDevDataFmtCfg_t
#
rxChanEn=15;
adcBitsD=2;
adcFmt=1;
iqSwapSel=0;
chInterleave=0;
#END

#
#Low power config Paramters, please modify if needed.
#rlLowPowerModeCfg_t
#
anaCfg=0;
lpAdcMode=0;
#END

#
#Data Path config parameters, please modify if needed
#rlDevDataPathCfg_t
#
intfSel=1;
transferFmtPkt0=1;
transferFmtPkt1=0;
cqConfig=2;
cq0TransSize=64;
cq1TransSize=64;
cq2TransSize=64;
#END

#
#LVDS clock config parameters, please modify if needed
#rlDevDataPathClkCfg_t
#
laneClk=1;
dataRate=1;
#END

#
#SET HSI clock parameters, please modify if needed.
#rlDevHsiClk_t
#
hsiClk=9
#END

#
#LANE config parameters, please modify if needed.
#rlDevLaneEnable_t
#
laneEn=15;
#END

#
#LVDS Lane Config parameters, please modify if needed.
#rlDevLvdsLaneCfg_t
#
laneFmtMap=0;
laneParamCfg=1;
#END

#
#Programmable Filter config parameters, please modify if needed.
#rlRfProgFiltConf_t
#
profileId=0;
coeffStartIdx=0;
progFiltLen=0;
progFiltFreqShift=45;
#END

#
#Profile config parameters, please modify if needed.
#rlProfileCfg_t
#
profileId=0;
pfVcoSelect=2;
startFreqConst=1439117143;
idleTimeConst=10000;
adcStartTimeConst=600;
rampEndTime=6000;
txOutPowerBackoffCode=0;
txPhaseShifter=0;
freqSlopeConst=621;
txStartTime=0;
numAdcSamples=256;
digOutSampleRate=10000;
hpfCornerFreq1=0;
hpfCornerFreq2=0;
rxGain=50;
#END

#
#Profile config parameters, please modify if needed.
#rlProfileCfg_t
#
profileId=1;
pfVcoSelect=2;
startFreqConst=1439117143;
idleTimeConst=1000;
adcStartTimeConst=700;
rampEndTime=6000;
txOutPowerBackoffCode=0;
txPhaseShifter=0;
freqSlopeConst=621;
txStartTime=0;
numAdcSamples=256;
digOutSampleRate=10000;
hpfCornerFreq1=0;
hpfCornerFreq2=0;
rxGain=30;
#END

#
#Profile config parameters, please modify if needed.
#rlProfileCfg_t
#
profileId=2;
pfVcoSelect=2;
startFreqConst=1439117143;
idleTimeConst=1000;
adcStartTimeConst=800;
rampEndTime=6000;
txOutPowerBackoffCode=0;
txPhaseShifter=0;
freqSlopeConst=621;
txStartTime=0;
numAdcSamples=256;
digOutSampleRate=10000;
hpfCornerFreq1=0;
hpfCornerFreq2=0;
rxGain=30;
#END

#
#Profile config parameters, please modify if needed.
#rlProfileCfg_t
#
profileId=3;
pfVcoSelect=2;
startFreqConst=1439117143;
idleTimeConst=1000;
adcStartTimeConst=900;
rampEndTime=6000;
txOutPowerBackoffCode=0;
txPhaseShifter=0;
freqSlopeConst=621;
txStartTime=0;
numAdcSamples=256;
digOutSampleRate=10000;
hpfCornerFreq1=0;
hpfCornerFreq2=0;
rxGain=30;
#END

#
#Chirp Configuration parameters, please modify if needed.
#rlChirpCfg_t
#
chirpStartIdx=0;
chirpEndIdx=63;
profileIdCPCFG=0;
startFreqVar=0;
freqSlopeVar=0;
idleTimeVar=0;
adcStartTimeVar=0;
txEnable=1;
#END

#
#Chirp Configuration parameters, please modify if needed.
#rlChirpCfg_t
#
chirpStartIdx=64;
chirpEndIdx=127;
profileIdCPCFG=0;
startFreqVar=0;
freqSlopeVar=0;
idleTimeVar=0;
adcStartTimeVar=0;
txEnable=2;
#END

#
#Frame configuration parameters, please modify if needed.
#rlFrameCfg_t
#
chirpStartIdxFCF=0;
chirpEndIdxFCF=127;
frameCount=10;
loopCount=1;
periodicity=80000000;
#20000000
triggerDelay=0;
numAdcSamples=512;
triggerSelect=1;
#END

#
#Advance Frame configuration parameters, please modify if needed.
numOfSubFrames=4;
forceProfile=0;
numFrames=100;
loopBackCfg=0;
triggerSelect=1;
frameTrigDelay=0;
#end

#
#4th sub Frame configuration parameters, please modify if needed.
forceProfileIdx=0;
chirpStartIdxAF=0;
numOfChirps=1;
numLoops=8;
burstPeriodicity=5000000;
chirpStartIdxOffset=0;
numOfBurst=1;
numOfBurstLoops=1;
subFramePeriodicity=5000000;
numAdcSamplesAF=256
numChirpsInDataPacket=1
#end

#
#3rd sub Frame configuration parameters, please modify if needed.
forceProfileIdx=0;
chirpStartIdxAF=0;
numOfChirps=1;
numLoops=8;
burstPeriodicity=5000000;
chirpStartIdxOffset=0;
numOfBurst=1;
numOfBurstLoops=1;
subFramePeriodicity=5000000;
numAdcSamplesAF=256
numChirpsInDataPacket=1
#end

#
#2nd sub Frame configuration parameters, please modify if needed.
forceProfileIdx=0;
chirpStartIdxAF=0;
numOfChirps=1;
numLoops=8;
burstPeriodicity=5000000;
chirpStartIdxOffset=0;
numOfBurst=1;
numOfBurstLoops=1;
subFramePeriodicity=5000000;
numAdcSamplesAF=256
numChirpsInDataPacket=1
#end

#
#1st sub Frame configuration parameters, please modify if needed.
forceProfileIdx=0;
chirpStartIdxAF=0;
numOfChirps=1;
numLoops=8;
burstPeriodicity=5000000;
chirpStartIdxOffset=0;
numOfBurst=1;
numOfBurstLoops=1;
subFramePeriodicity=5000000;
numAdcSamplesAF=256
numChirpsInDataPacket=1
#end

#
#Continuous mode config parameters
#startFreqConst=1435384036;
#txOutPowerBackoffCode=0;
#txPhaseShifter=0;
#digOutSampleRate=10000;
#hpfCornerFreq1=0;
#hpfCornerFreq2=0;
contModeRxGain=30;
vcoSelect=3388;
#end

#
#Advanced chirp config parameters
AdvChirp_chirpParamIdx=0;
AdvChirp_resetMode=0;
AdvChirp_deltaResetPeriod=0;
AdvChirp_deltaParamUpdatePeriod=0;
AdvChirp_sf0ChirpParamDelta=0;
AdvChirp_sf1ChirpParamDelta=0;
AdvChirp_sf2ChirpParamDelta=0;
AdvChirp_sf3ChirpParamDelta=0;
AdvChirp_lutResetPeriod=4;
AdvChirp_lutParamUpdatePeriod=1;
AdvChirp_lutPatternAddressOffset=0;
AdvChirp_numPatterns=4;
AdvChirp_lutBurstIndexOffset=0;
AdvChirp_lutSfIndexOffset=0;
AdvChirp_lutChirpParamSize=0;
AdvChirp_lutChirpParamScale=0;
AdvChirp_maxTxPhShifIntDither=0;
#end

#
#Advanced chirp Profile config LUT parameters
#Each data parameter is 4 bits
AdvChirpLUT_ProfileConfig_LUTAddrOff=0;
AdvChirpLUT_ProfileConfig_Data1=0;
AdvChirpLUT_ProfileConfig_Data2=1;
AdvChirpLUT_ProfileConfig_Data3=2;
AdvChirpLUT_ProfileConfig_Data4=3;
#end

#
#Advanced chirp Start Freq config LUT parameters
#The Start Freq data is in GHz
#Each data parameter is 1 or 2 or 4 bytes depending on ParamSize
# ParamSize    Size in bytes
#     0             4
#     1             2
#     2             1
AdvChirpLUT_StartFreqConfig_LUTAddrOff=4;
AdvChirpLUT_StartFreqConfig_ParamSize=1;
AdvChirpLUT_StartFreqConfig_ParamScale=0;
AdvChirpLUT_StartFreqConfig_Data1=-0.000001;
AdvChirpLUT_StartFreqConfig_Data2=0.000000;
AdvChirpLUT_StartFreqConfig_Data3=0.000001;
AdvChirpLUT_StartFreqConfig_Data4=-0.000001;
#end

#
#Advanced chirp Freq Slope config LUT parameters
#The Freq Slope data is in MHz/us
#Each data parameter is 1 byte
AdvChirpLUT_FreqSlopeConfig_LUTAddrOff=12;
AdvChirpLUT_FreqSlopeConfig_Data1=-0.050;
AdvChirpLUT_FreqSlopeConfig_Data2=0.000;
AdvChirpLUT_FreqSlopeConfig_Data3=-0.050;
AdvChirpLUT_FreqSlopeConfig_Data4=0.050;
#end

#
#Advanced chirp Idle time config LUT parameters
#The Idle time data is in us
#Each data parameter is 1 or 2 bytes depending on ParamSize
# ParamSize    Size in bytes
#     0             2
#     1             1
AdvChirpLUT_IdleTimeConfig_LUTAddrOff=16;
AdvChirpLUT_IdleTimeConfig_ParamSize=0;
AdvChirpLUT_IdleTimeConfig_ParamScale=0;
AdvChirpLUT_IdleTimeConfig_Data1=0.01;
AdvChirpLUT_IdleTimeConfig_Data2=0.02;
AdvChirpLUT_IdleTimeConfig_Data3=0.00;
AdvChirpLUT_IdleTimeConfig_Data4=0.01;
#end

#
#Advanced chirp ADC time config LUT parameters
#The ADC start time data is in us
#Each data parameter is 1 or 2 bytes depending on ParamSize
# ParamSize    Size in bytes
#     0             2
#     1             1
AdvChirpLUT_ADCTimeConfig_LUTAddrOff=24;
AdvChirpLUT_ADCTimeConfig_ParamSize=0;
AdvChirpLUT_ADCTimeConfig_ParamScale=0;
AdvChirpLUT_ADCTimeConfig_Data1=0.02;
AdvChirpLUT_ADCTimeConfig_Data2=0.01;
AdvChirpLUT_ADCTimeConfig_Data3=0.00;
AdvChirpLUT_ADCTimeConfig_Data4=0.01;
#end

#
#Advanced chirp Tx Enable config LUT parameters
#Each data parameter is 4 bits
#b0:TX0 ; b1:TX1; b2:TX2
AdvChirpLUT_TxEnConfig_LUTAddrOff=32;
AdvChirpLUT_TxEnConfig_Data1=7;
AdvChirpLUT_TxEnConfig_Data2=3;
AdvChirpLUT_TxEnConfig_Data3=1;
AdvChirpLUT_TxEnConfig_Data4=2;
#end

#
#Advanced chirp BPM Enable config LUT parameters
#Each data parameter is 4 bits
#b0:TX0 ; b1:TX1; b2:TX2
AdvChirpLUT_BpmEnConfig_LUTAddrOff=36;
AdvChirpLUT_BpmEnConfig_Data1=7;
AdvChirpLUT_BpmEnConfig_Data2=3;
AdvChirpLUT_BpmEnConfig_Data3=1;
AdvChirpLUT_BpmEnConfig_Data4=2;
#end

#
#Advanced chirp Tx0 Phase Shifter config LUT parameters
#The phase shifter data is in degrees
#Each data parameter is 1 byte
AdvChirpLUT_Tx0PhShiftConfig_LUTAddrOff=40;
AdvChirpLUT_Tx0PhShiftConfig_Data1=5.625;
AdvChirpLUT_Tx0PhShiftConfig_Data2=11.250;
AdvChirpLUT_Tx0PhShiftConfig_Data3=16.875;
AdvChirpLUT_Tx0PhShiftConfig_Data4=16.875;
#end

#
#Advanced chirp Tx1 Phase Shifter config LUT parameters
#The phase shifter data is in degrees
#Each data parameter is 1 byte
AdvChirpLUT_Tx1PhShiftConfig_LUTAddrOff=44;
AdvChirpLUT_Tx1PhShiftConfig_Data1=0.000;
AdvChirpLUT_Tx1PhShiftConfig_Data2=5.625;
AdvChirpLUT_Tx1PhShiftConfig_Data3=0.000;
AdvChirpLUT_Tx1PhShiftConfig_Data4=5.625;
#end

#
#Advanced chirp Tx2 Phase Shifter config LUT parameters
#The phase shifter data is in degrees
#Each data parameter is 1 byte
AdvChirpLUT_Tx2PhShiftConfig_LUTAddrOff=48;
AdvChirpLUT_Tx2PhShiftConfig_Data1=5.625;
AdvChirpLUT_Tx2PhShiftConfig_Data2=0.000;
AdvChirpLUT_Tx2PhShiftConfig_Data3=5.625;
AdvChirpLUT_Tx2PhShiftConfig_Data4=0.000;
#end
And here is my cf.json:
{
  "DCA1000Config": {
    "dataLoggingMode": "raw",
    "dataTransferMode": "LVDSCapture",
    "dataCaptureMode": "ethernetStream",
    "lvdsMode": 1,
    "dataFormatMode": 3,
    "packetDelay_us": 25,
    "ethernetConfig": {
      "DCA1000IPAddress": "192.168.33.180",
      "DCA1000ConfigPort": 4096,
      "DCA1000DataPort": 4098
    },
    "ethernetConfigUpdate": {
      "systemIPAddress": "192.168.33.30",
      "DCA1000IPAddress": "192.168.33.180",
      "DCA1000MACAddress": "12.34.56.78.90.12",
      "DCA1000ConfigPort": 4096,
      "DCA1000DataPort": 4098
    },
    "captureConfig": {
      "fileBasePath": "C:\\ti\\mmwave_studio_03_00_00_14\\mmWaveStudio\\Scripts\\..\\PostProc",
      "filePrefix": "adc_data",
      "maxRecFileSize_MB": 1024,
      "sequenceNumberEnable": 1,
      "captureStopMode": "infinite",
      "framesToCapture": 10
    },
    "dataFormatConfig": {
      "MSBToggle": 0,
      "laneFmtMap": 3,
      "reorderEnable": 0,
      "dataPortConfig": [
        {
          "portIdx": 0,
          "dataType": "complex"
        },
        {
          "portIdx": 1,
          "dataType": "complex"
        },
        {
          "portIdx": 2,
          "dataType": "complex"
        },
        {
          "portIdx": 3,
          "dataType": "complex"
        },
        {
          "portIdx": 4,
          "dataType": "complex"
        }
      ]
    }
  }
}
Thanks for the attentions.