This thread has been locked.

If you have a related question, please click the "Ask a related question" button in the top right corner. The newly created question will be automatically linked to this question.

LDC1614: The number of data points displayed in the LDC1614 EVM GUI and excel is inconsistent with the time measured by the timer.

Part Number: LDC1614

I'm a student in Taiwan and I bought your LDC1614. However, I have a problem about the sensing points which are output to Excel. In the normal condition, the sensing points according to the sample rate setting on EVM GUI can calculate the time I spend on a sensing process. At the same time, I keep time with my phone timer. I got the different time from calculating and timing and the difference cannot be due to human error because they are 6 seconds apart. I post my measurement in the following picture.

.

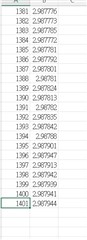
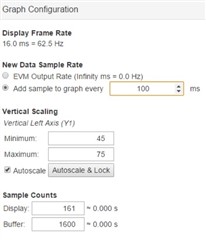
In this condition, I use sample rate 100ms and timing for 150sec. In normal condition, I will receive 1500 data points but I only got 1401 data points on GUI and Excel. I try many times and still got the same error. I don't know what the problem is, so I use E2E in Chinese before. The engineer there told me that I should follow the step of the this reply https://e2e.ti.com/support/sensors-group/sensors/f/sensors-forum/1033319/ldc1314evm-evm-gui-sampling-time/3821026?tisearch=e2e-sitesearch&keymatch=LDC1614EVM%252525252520Add%252525252520sample%252525252520to%252525252520graph%252525252520every#3821026

In this communication, they mentioned ' If the timing of the samples recorded is critical for your testing with the EVM, it would be best to use the older firmware or a different method of collecting samples (either interacting with the MSP directly, creating your own firmware, or using an external controller). ' But I don't how to do this. Can you help me, please?

Thank you!

Best regards,

  • Hello, 

    Sorry you are having this issue. I have a few more questions about the issue with the GUI data collection: 

    • Can you share your data graph configuration setting? 
    • Is the timing between the samples in the excel still showing as 100ms? 
    • Are you opening the excel file immediately after the data collection stops? If so, does the issue persist if you wait a minute before opening the file? 
      • I am just wondering if this is an issue where the data is stuck in a buffer and can't write to the file completely. 
    • Lastly, if you plot the data in excel, does the graph look similar to that of the GUI? Are you missing data at the beginning or the end of the graph? 

    In regards to your question at the end, here are more details on the different options: 

    • For firmware updates, you can use the Sensing Solutions GUI to update the firmware of the EVM. Firmware for Rev A and Rev B of the LDC1614EVM are installed with the Sensing Solutions GUI so you just have to direct the firmware updater to the proper file. By default, firmware files are stored here: C:\ti\Sensing Solutions EVM GUI-1.10.0\EVM Firmware. This may change depending on where you installed the Sensing Solutions GUI. 
    • For creating your own firmware, you would need to use Code Composer Studio to program the MSP430 on the EVM to take samples at the desired rate and communicate them back to the computer. Essentially, you would just need to configure the LDC1614 and collect samples as often as you want before sending them over USB to the computer to be logged. 
    • For interacting with the MSP directly, we have information on writing a python script to handle this at the following links: 
    • For using an external controller, this would be anything you are already familiar working with that supports I2C. I've seen Arduino or Analog Discovery modules be used for this in the past. You then connect your external controller to the I2C pins of the LDC1614EVM directly and do not use the MSP portion of the board. 

    Best Regards, 

    Justin Beigel

  • This is my setting then.

    1.About

    • Is the timing between the samples in the excel still showing as 100ms?

       this question, I cannot find this information in excel.

    2.About

    • Are you opening the excel file immediately after the data collection stops? If so, does the issue persist if you wait a minute before opening the file?

        this question, I will test.

    3.About

    • Lastly, if you plot the data in excel, does the graph look similar to that of the GUI? Are you missing data at the beginning or the end of the graph? 

        this question, the graphs done by the data in excel are the same as the graphs in GUI. Additionally, the first point in excel and GUI are the       

        same, and the last points are the same as well.

    4.About the opinions you provide, I am happy to see these explanations and description in detail. I will give it a try, but the origin problem still needs to be

       solve.

    Thank you,

    Best regards,

  • Hello, 

    Thank you for the information. It seems it is more of an issue updating the graph in general rather than saving the data. If you change the new data sample rate from every 100ms to the EVM Output Rate, what is the sample rate that appears for your configuration?

    Thank you, 

    Justin Beigel