This thread has been locked.
If you have a related question, please click the "Ask a related question" button in the top right corner. The newly created question will be automatically linked to this question.
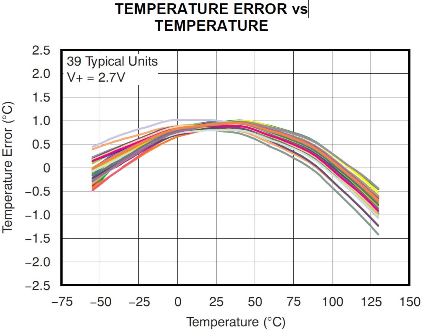
Questions regarding the family of curves depicted in Figure 7 of the TMP20 datasheet. (SBOS466-DECEMBER 2009).
How is the temperature calculated from the 39 units under test? Using 1st or 2nd order functions?
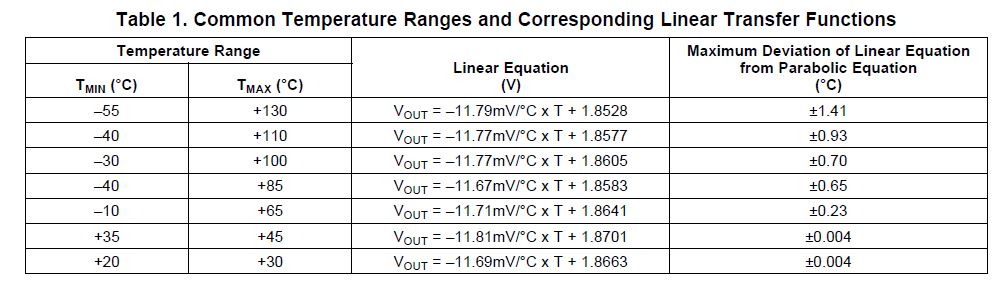
Vo = –11.79 x T + 1.8528 [mV] → (-55°C < T < 130°C),
or
Vo = (–3.88 × 10–^6 × T^2) + (–1.15 × 10–^2 × T) + 1.8639 [V],
From looking at the data, it seems like a 2nd order correction would greatly increase the accuracy (±0.5°C). Would you agree?
Hello Eric,
Yes it would and the graph listed in Figure7. already takes the 2nd order equation into account.
Regards,
Abhi
Hello Eric,
Behavior of Temperature Error with respect to Temperature will wary from part to part. especially between an Analog out and Digital out temp sensors. Internal design core and usage of an internal data converter determines this curve pattern. I cannot disclose you the exact details behind the reason why the graph looks the way it is due to TI's confidentiality reasons. On the other hand, whats your target application and does your application require you to follow the pattern like the graph you posted?
Do let me know the details of your application and I will be able to assist you towards the right direction.
Regards,
Abhi
Hello Abhi,
I do understand that error will vary between an analog and digital out part. In this case, I'm talking about a specific analog out part (TMP20). I'm asking for information specific to this part and not temperature sensors in general.
What I'm saying is that the error curve over the full temperature range - for 39 parts - follows a 2nd degree function. Since this function can be estimated (best fit method) it would greatly increase the accuracy of the output. I don't understand why the error looks more deterministic than random.
Could Figure 7 be depicting values for row 1 in Table 1 (Temperature limits and maximum deviation seem to correspond → See ±1.41 on graph @ 130°C)
Hello Eric,
Apologies for the delayed response. I Agree with you on the note that the Error is deterministic than random and estimating this error will increase the accuracy of the device. But to implement this correction in an analog out part such as TMP20 is quite intensive in terms of design circuitry that goes with it internally. If the host device can further process the curve fit, error could be reduced drastically.
Best Regards,
Abhi
Hi all,
Sorry for butting in here but I couldn't resist. Please forgive me Abhi... But the TMP20 is a second source for the LM20 and in order for it to be a second source it had to match the transfer function of the LM20. This all happened before TI purchased National a long long time ago. Now TI does not have the same process as National Semiconductor did so their temperature sensor would have a slightly different transfer function target than the LM20 thus the more deterministic curvature.
Take care,