Other Parts Discussed in Thread: TMS320F28035
Hi,
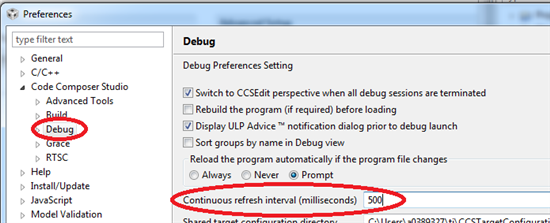
In the graph tool properties (CCS5.5) I can choose a “Sampling rate in Hz”. I thought it would increase the update speed of the values but it does not change anything. What is it good for?
Is it possible to draw a graph in realtime with the graph tool. The customer asks about how to draw a graph of a variable that gests updated with 18kHz. I will tell him to buffer the samples in the device and read out the buffer afterwards but I’m also curious if it is possible e.g. with a XDS560 trace emulator to read out single values with this speed and draw it. Is this possible with the graph tool?


