Part Number: TM4C1297NCZAD
Tool/software: Code Composer Studio
I almost have my development environment set up with Code Composer 6.2.0.00050 and the TM4C129X Development Board connected to our controller board. I am able to build the code and download it to the target without any problems (as far as I am aware). I have hooked up a DC power supply to run our board (instead of a noisy switching power supply).
Before I was getting these messages:
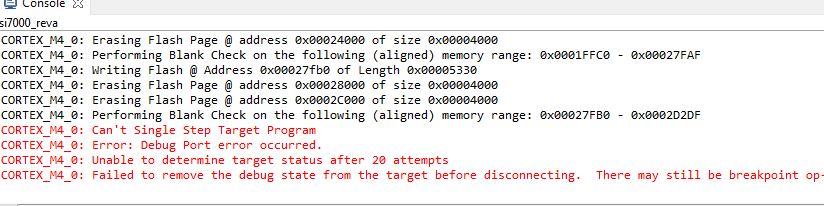
CORTEX_M4_0: Error: Debug Port error occurred
CORTEX_M4_0: Trouble Halting Target CPU
The first fix was to locate a file on my hard drive where source code is (not our source code), since I imported this project from someone else's computer who had a different file directory structure.
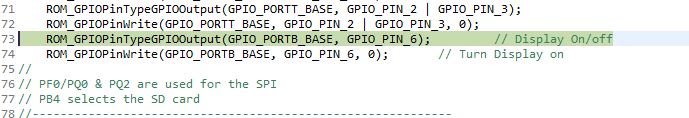
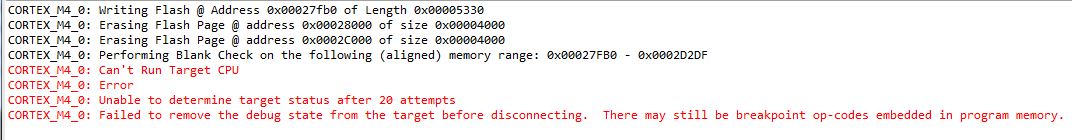
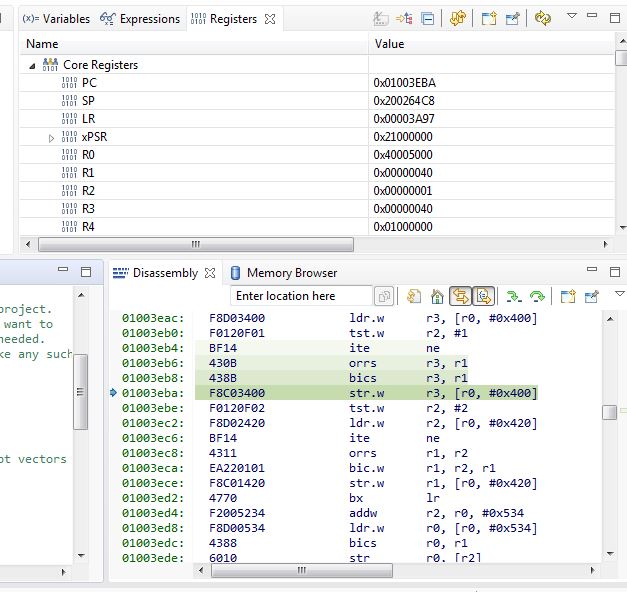
Now I am able step along for some distance until I get to the code in the first screen shot. Once I press F5 again, it goes away, and I no longer have any control of the debugger.
Any ideas?