This thread has been locked.

If you have a related question, please click the "Ask a related question" button in the top right corner. The newly created question will be automatically linked to this question.

CCS/MSP432P4111: CCSv8 Resource Explorer, Getting Started, CCS App Center not working

Part Number: MSP432P4111

Tool/software: Code Composer Studio

CCS v 8.1.0.00011

Windows 10

New install, antivirus, firewall, application security all off during install.   Installer run as System Administrator.

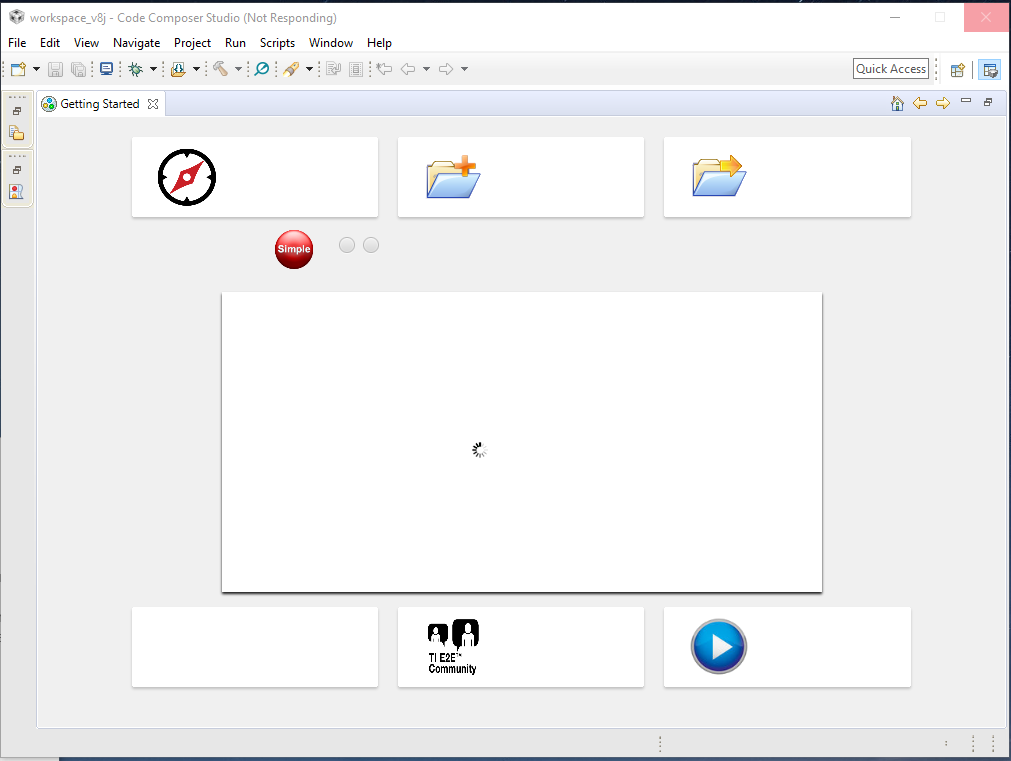
Upon start, opening the web-provisioned window/tabs will result in a quick black flash (tab initiation), then appear white with no connection or results.

No effect from:

- deleting <APPDATA>\Local\JxBrowser  folder

- changing workspace

- deleting the workspace \ .jxbrowswer-data  cache

- deleting the tirex-localserver  folder

- changing to use external web browser (Chrome, IE, Edge)

If change to use external web, Firefox -- the Resource Explorer tab will display "LOADING. . .  Starting TIREX..."  then the mouse pointer changes indicating "activity state" and CCS hangs ("Not Responding").  For other tabs, the relevant window flashes, turns grey (appears to functioning), then the CCS "Not Responding" status.  Once not responding the program can only be terminated by killing the process (allowed 30 minutes just in case of slow response).

At various times, actual error windows have appeared "Profile error occurred", "Failed to create the part's controls".

Noticed this in the tirex log:

{

"stamp": "2018-08-01T23:25:42.395Z",
"priority": "INFO",
"facility": "DAEMON",
"service": "tirex",
"args": [
"localserver",
"Connected to remote server host: http://dev.ti.com/tirex"
]
},

In the workspace log, there are numerous Exceptions

!ENTRY org.eclipse.equinox.event 4 0 2018-08-01 15:31:16.643
!MESSAGE Exception while dispatching event org.osgi.service.event.Event [topic=org/eclipse/e4/ui/model/application/ApplicationElement/tags/ADD] {ChangedElement=org.eclipse.e4.ui.model.application.ui.basic.impl.PartStackImpl@16a6d46 (elementId: org.eclipse.e4.primaryDataStack, tags: [org.eclipse.e4.primaryDataStack, EditorStack, active, Maximized], contributorURI: null) (widget: CTabFolder {}, renderer: org.eclipse.e4.ui.workbench.renderers.swt.StackRenderer@1693b1d, toBeRendered: true, onTop: false, visible: true, containerData: null, accessibilityPhrase: null), org.eclipse.e4.data={ChangedElement=org.eclipse.e4.ui.model.application.ui.basic.impl.PartStackImpl@16a6d46 (elementId: org.eclipse.e4.primaryDataStack, tags: [org.eclipse.e4.primaryDataStack, EditorStack, active, Maximized], contributorURI: null) (widget: CTabFolder {}, renderer: org.eclipse.e4.ui.workbench.renderers.swt.StackRenderer@1693b1d, toBeRendered: true, onTop: false, visible: true, containerData: null, accessibilityPhrase: null), AttName=tags, EventType=ADD, Position=3, Widget=CTabFolder {}, NewValue=Maximized}, AttName=tags, EventType=ADD, Position=3, Widget=CTabFolder {}, NewValue=Maximized} to handler org.eclipse.e4.ui.internal.di.UIEventObjectSupplier$UIEventHandler@1897ffb
!STACK 0
org.eclipse.e4.core.di.InjectionException: java.lang.IllegalArgumentException:

<snip>

Caused by: java.lang.IllegalArgumentException:
at org.eclipse.core.runtime.Assert.isLegal(Assert.java:63)
at org.eclipse.core.runtime.Assert.isLegal(Assert.java:47)
at org.eclipse.e4.ui.internal.workbench.ModelServiceImpl.findElementsRecursive(ModelServiceImpl.java:146)
at org.eclipse.e4.ui.internal.workbench.ModelServiceImpl.findElements(ModelServiceImpl.java:397)
at org.eclipse.e4.ui.internal.workbench.ModelServiceImpl.findElements(ModelServiceImpl.java:383)
at org.eclipse.e4.ui.internal.workbench.ModelServiceImpl.getActivePerspective(ModelServiceImpl.java:962)
at org.eclipse.e4.ui.workbench.addons.minmax.MinMaxAddon.getElementsToMinimize(MinMaxAddon.java:726)
at org.eclipse.e4.ui.workbench.addons.minmax.MinMaxAddon.maximize(MinMaxAddon.java:699)
at org.eclipse.e4.ui.workbench.addons.minmax.MinMaxAddon.subscribeTopicTagsChanged(MinMaxAddon.java:387)
at sun.reflect.GeneratedMethodAccessor2.invoke(Unknown Source)
at sun.reflect.DelegatingMethodAccessorImpl.invoke(DelegatingMethodAccessorImpl.java:43)
at java.lang.reflect.Method.invoke(Method.java:498)
at org.eclipse.e4.core.internal.di.MethodRequestor.execute(MethodRequestor.java:55)
... 150 more

Others appear to relate to an automatic update attempt.  Culminates in:

!ENTRY org.eclipse.e4.ui.workbench 1 0 2018-08-01 16:26:37.616
!MESSAGE REX 1533165997616 [menu] Failed to start server within timeout period

!ENTRY org.eclipse.e4.ui.workbench 1 0 2018-08-01 16:26:37.640
!MESSAGE REX 1533165997640 Changing URL to file:/C:/ti/ccsv8/eclipse/..\tirex\ti-rex-core\public\plugin\serverdidnotstart.html


(Also, whether clean or forced program exit, there tend to be orphan processes left running.  Depending upon conditions, can be multiples of each: ccstudio.exe,  "JxBrowser Chromium Native" and "EventedI/O for V8 Javascript"

  • Dale,

    In other cases where similar issues were reported, deleting the folder C:\Users\<loginid>\AppData\Local\JxBrowser and restarting CCS fixed the issue. But it appears that you have tried this already and it did not help.

    Let me try to pull in some experts to see if they have additional suggestions.

  • Hi Dale,
    Are you able to open the Getting Started window? I like to see whether this is generic browser issue or specific to a window. You can use a new workspace and the Getting Started window is the first window that you will see.

    CCS uses the jxbrowser (chromium) for the browser window, switching the external browser type has no affect on the browser window. With the exception of the Internal Browser window. You can change the browser rendering engine that CCS use by opening the preferences window and select 'Code Composer Studio' in the tree, try the JavaFX option. The Internal Browser option will be based on the browser selection that you have selected in the other setting.

    Have you try deleting the cache directories for the jxbrowser? It could be that it is corrupted. The cache folder is here: C:\Users\myid\AppData\Local\JxBrowser.

    Regards,
    Patrick
  • Thanks for the attention, Patrick

    I guess the meaning of my original post could be uncertain -- yes, the tabs open, but they displayed no content (except sometimes the change to gray background, which appears to be first step.)  Additional testing today has added some information about this, and at least a better handle on what is not happening.

    I spent a couple days before posting trying a variety of things from the forums which were reported to work for others, including both JavaFX and Internal Browser as well as changing workspaces.

    But, it is certainly possible that I missed something, or did not try an exact combination which would give success. Today's testing indicate that during the earlier test I got in the way a bit, not understanding that the selection of JavaFX WebKit is stored in the workspace -- so I never actually previously observed the results.

    NOTE: For any other users who are changing the browser to JavaFX Webkit, do not switch the workspace at the same time. It is a two-step process -- start CCS with a given workspace, change the browser preference, then stop CCS. Restart CCS and select the same workspace.


    Summary results of todays testing:

    a. There is demonstrated network traffic when first opening an new workspace (default JxBrowser), but it is only a ~1/2 second exchange, then nothing.  That exchange seems to download the first part of the Getting Started content.  (I would expect that opening the Resource Browser tab also obtains initial content.)

    b. After switching to JavaFX WebKit, there is partial content to the Getting Started tab (but this seems to be obtained from initial population of the .jxbrowser cache by the prior JxBrowser start).  After posting the partial content in the tab, CCS (JavaFX) hangs in the "(Not Responding)" [wait] state.  No network traffic is seen from JavaFX.

    A little more speculation at the end, but the test sequence and results are relevant and I'm not sure how to convincingly summarize, so leaving it there.


    The steps of today's testing (regret that it is so repetitive, incremental steps):

    (I've kept all of the workspaces in case one of the logs might be useful.)

    1. Delete %APPDATA%\Local\JxBrowser
    2. Create new workspace folder [v8h]
    3. Start CCS ; selecting the new workspace [v8h]

    The Getting Started tab appears, it has no content (only white).

    LATER: I believe I now am seeing a quick flash to gray (the "correct" background) then black, then to white.
    First thought the flashing was SWT/Swing initialization, but it now seem to be the initial correct background then failure to display content which has been obtained.

    4. Menu -> View -> Resource Explorer

    The Resource Explorer tab appears, flashes, ultimately has no content.

    5. Wait 5 minutes (in case of some wild delivery delay) ... still no content.

    6. Close the Getting Started and Resource Browser tabs.

    7. Menu -> Window -> Preferences -> Code Composer Studio

    select the radio button for JavaFX WebKit

    Apply ; Apply and Close

    8. Close CCS

    The results in the following background processes still shown in the Task Manager:

    [1] ccstudio.exe
    [1] Evented I/O for V8 JavaScript
    [2] JxBrowser Chromium Native (after ~30 seconds these two terminated)

    9. Delete %APPDATA%\Local\JxBrowser
    10. Create another workspace folder [v8i]
    11. Start CCS ; selecting the newest workspace [v8i]

    The Getting Started tab appears, no content.

    12. Check Menu -> Window -> Preferences -> Code Composer Studio

    the "Chromium" radio button is on

    [[The selection of JavaFX WebKit has not persisted over the restart. Must be stored in the workspace.]]

    13. Select the JavaFX radio button.

    Apply ; Apply and Close

    14. Menu -> Window -> Preferences -> Code Composer Studio

    JavaFX radio button remains selected.

    Apply and Close

    15. Close the Getting Started tab

    16. Close CCS

    Background processes still shown in the Task Manager:

    [1] ccstudio.exe
    [2] Evented I/O for V8 JavaScript
    [2] JxBrowser Chromium Native (after ~60 seconds these two terminated)

    17. Delete %APPDATA%\Local\JxBrowser

    18. Start CCS ; selecting the most recent workspace [v8i] (now with JavaFX selected)

    19. Menu -> View -> Getting Started

    Not the same black flashing
    content area remains white
    mouse pointer changes to "active"
    CCS enters the "(Not Responding)" state


    Of course, on the first CCS startup after install, the Windows Pretender (I mean Windows Defender) firewall asked about some applications and I allowed them all.
    Not getting any indication now. But, maybe that's the problem.


    20. Terminated CCS (with prejudice)
    21. Cleaned up the orphaned background processes from the Task Manager
    22. Create another workspace folder [v8j] (in case of corruption from the forced halt)
    23. Check there is no %APPDATA%\Local\JxBrowser
    24. Turned off the firewall


    25. Start CCS ; selecting the new workspace [v8j]

    (NOTE: Default back to JxBrowser)

    The Getting Started page flashes, no content.

    26. Opened Killer Control Center to see if there was any noticable data transfer

    JxBrowser Chromium Native is shown, however
    no activity ongoing from Getting Started

    27. Menu -> View -> Resource Explorer

    Killer Control Center shows Node.js start and indication of both upload and download for ~< 1 second, then the transfer stops. Shortly, Node.js is dropped from the active list. By the time I check the Task Manager, there is no Node.js

    The Resource Explorer tab is not populated with content.

    28. Check Windows Control Panel, firewall, "Allowed apps"

    The following are allowed on the Private network:

    ccstudio
    Evented I/O for V8 Javascript
    Node.exe [cloudagent]
    Node.js [tirex]

    29. Close Getting Started and Resource Explorer tabs

    30. Preferences -> Code Composer Studio

    select the radio button for JavaFX WebKit

    Apply ; Apply and Close

    31. Close CCS

    The following background processes still shown in the Task Manager:

    [1] ccstudio.exe
    [1] Evented I/O for V8 JavaScript
    [2] JxBrowser Chromium Native


    32. Start CCS ; selecting the most recent workspace [v8j] (with JavaFX selected)

    33. Menu -> View -> Getting Started

    Error window:

    Profile error occurred
    Something went wrong when opening your profile. Some features may be unavailable.

    (I opted to send Feedback)

    There was some activity shown by Task Manager performance tab, but about the same time the JxBrowser application was dropped from the Killer Control active process list. And, Windows Task Manager shows one of the JxBrowser processes ended (one remains).

    The Getting Started tab now has a ("correct") grey background for "content."

    34. Close CCS

    The following background processes still shown in the Task Manager:

    [1] ccstudio.exe
    [2] Evented I/O for V8 JavaScript
    [1] JxBrowser Chromium Native


    35. Start CCS ; selecting the most recent workspace [v8j] (with JavaFX selected) [in case the former was an unrelated fluke]

    Now [for the first time] there is partial content in the Getting Started tab, grey background and the expected white rectangular "buttons", but no labels/text on the buttons -- Graphic elements, but no text. It looks like the content is not complete, and there is an activity spinner, but it is immobile.
    [window clip at bottom]

    CCS is again "(Not Responding)"

    If there was any network traffic, it happened too quickly for me to notice in the Task Manager or Killer CC.

    36. Terminated CCS (with prejudice)
    37. Cleaned up the orphaned processes from the Task Manager
    38. Delete %APPDATA%\Local\JxBrowser

    39. Create another workspace folder [v8k]

    40. Start CCS ; selecting the new/clean workspace folder [v8k]

    Same outcome, black flash, back to white content. Did observe/confirm a spike of network activity.

    41. Preferences -> Code Composer Studio

    select the radio button for JavaFX WebKit

    Apply ; Apply and Close

    42. Close CCS

    The following background processes still shown in the Task Manager:

    [1] ccstudio.exe
    [2] Evented I/O for V8 JavaScript
    [1] JxBrowser Chromium Native

    43. Terminated processes:

    [2] Evented I/O for V8 JavaScript
    [1] JxBrowser Chromium Native

    After a moment, the ccstudio process self-terminated.

    44. Delete %APPDATA%\Local\JxBrowser

    45. Start CCS ; selecting the new workspace folder [v8k] (now JavaFX WebKit)

    Getting Started tab shows no flashing, no content.

    No network activity observed.

    CCS is "(Not Responding)"

    46. Terminated CCS (with prejudice)
    47. Cleaned up the orphaned processes from the Task Manager
    48. Check no %APPDATA%\Local\JxBrowser

    49. Create another workspace folder [v8m]

    50. Start CCS ; selecting the new/clean workspace folder [v8m]

    No content. Again about 1/2 second network activity.

    51. Preferences:

    General -> Always run in background == unchecked

    Apply

    CCS -> JavaFX WebKit

    Apply ; Apply and Close

    52. Close CCS

    The following background processes still shown in the Task Manager:

    [1] ccstudio.exe (self-terminated after ~ 60 seconds)
    [1] Evented I/O for V8 JavaScript
    [2] JxBrowser Chromium Native (self-terminated after ~ 60 seconds)

    53. Ended the Evented I/O from the Task Manager

    54. Start CCS ; selecting the same workspace folder [v8m] (now JavaFX WebKit)

    [[Testing to see if the background process has any bearing.]]

    Again showing the incomplete Getting Started content.

    But no network traffic observed, guessing this is cached.

    And CCS is "(Not Responding)"

    55. Terminated CCS (with prejudice)

    As usual, ccstudio.exe becomes a background process, with subprocesses

    Console Window Howe
    Evented I/O
    Windows Command Processor

    56. Cleaned up the orphaned processes from the Task Manager
    57. Check no %APPDATA%\Local\JxBrowser

    58. Create another workspace folder [v8n]

    59. Start CCS ; selecting the new/clean workspace folder [v8n]

    No content. ~1/2 second network activity.

    60. Preferences:

    General -> Always run in background == unchecked

    Apply

    CCS -> JavaFX WebKit

    Apply ; Apply and Close

    61. Close CCS

    The following background processes still shown in the Task Manager:

    [1] ccstudio.exe (self-terminated after ~ 60 seconds)
    [1] Evented I/O for V8 JavaScript
    [2] JxBrowser Chromium Native (self-terminated after ~ 60 seconds)

    62. Ended the Evented I/O from the Task Manager

    63. Deleted %APPDATA%\Local\JxBrowser

    64. Removed content of

    %USER%\workspace_v8n\.jxbrowser-data\Cache
    and
    %USER%\workspace_v8n\.jxbrowser-data\GPUCache

    65. Start CCS ; select workspace v8n (JavaFX WebKit, jxbrowser cache empty)

    [[Testing to see if the displayed content is coming from JxBrowser cache]]

    No network activity.

    Getting Started tab displays no content.

    CCS is immediately "(Not Responding)"

    This leads to the hypothesis that the content being displayed by the JavaFX WebKit is actually coming from the .jxbrowser cache files. That is, with the first start in a workspace, there is a short network handshake by JxBrowser which gets the initial content ("button" placement), but JxBrowser never displays that content. When switched to JavaFX, that cached content is display but JavaFX is unable to continue.

    I also begin to wonder if the JxBrowser issue might be Java SWT/Swing related, or maybe some interaction with a GPU setting [GTX 1080 Ti in use here].

    So I would guess there are a couple paths for possible exploration: a) why JxBrowser does not display the cached content (and does not continue); and b) why/where JavaFX hangs.

  • Hi Dale,

    Without having you to spending time to debug this issue by your self, I like to have a webex remote debug session on this issue. Are you ok to have one? Let me know the best time that will work for you and I'll set one up. I'll try to schedule a time that will work for both of us. I am located in the eastern time zone (EST). 

    Regards,
    Patrick

  • Sure thing, Patrick.  I am on the West Coast [PST], so my morning is your afternoon.  This week is forecast to be incredibly hot here, so Wednesday is best, deteriorates as the days progress.  Suggesting 11 AM PDT / 2 EDT.

    I guess you'll be sending an email with the webex link.  Or PM, whichever.

    Thanks

  • Hi Dale,

    I have scheduled the webex at 2PM EDT, check email for detail.

    Regards,
    Patrick

  • I am on the same boat here, Resource Explorer is not working. Everything else seems fine. I would like to join the webex to debug this problem. Thank you!
  • Edwards,

    As I understand it, there is a webex app that opens up the client's [my] computer to a network server [Patrick] to allow the remote debugging. Though I don't think anyone else can get in, I am a little concerned that another "voice" may complicate the situation. After all, the cause of your issue could still be different than that of mine.
    From what I've seen before, if the webex session is successful, Patrick will report the results and solution shortly thereafter. So, you should be able to check whether it applies to your case. If not. then you can continue the discussion, or open your own thread.
    I hope you will understand my reluctance. But, I will defer to Patrick to decide as he better knows the issues of security and case management.

    Best Regards,
    Dale
  • Edwards,

    Please open a new thread and in the new thread can you please let me know whether the Getting Started page or the CCS App Center works for you or not? This can help to identify whether it it a resource explorer issue or a browser issue. 

    Thanks,
    Patrick

  • I used the same CCSv8 installation ZIP to install on a different machine (laptop) and everything functions correctly.

    Far from certain of the cause, but the machine with the problem is Win 10 Home (first O/S install), the laptop is Win 10 Pro (upgrade from Win 7).

    Checked the applications and services running on both machine -- a couple of potentially relevant services not running on the problem machine.  Starting them was ineffectual.

    So, at this point the only definite different (besides hardware) is the Home [problem] versus Pro [okay].

    I would still like to be able to resolve this, but it is not critical.  The SDK has adequate examples for import.

  • I have the Win 10 Pro version and experiencing the same problem
  • Thanks, Edward.  Might have saved myself $30 if I had waited.  To see if it would fix the problems, I upgraded the machine to Windows 10 Pro.  No change.  Now I have two machines with Windows 10 -- on one everything works, on the other the web content is unavailable and no connection can be made to the board (no flashing, no console, no debugging, no energy analysis, nothing).  

    If it were not for the functional laptop install and the combination of CCS, Uniflash, and the Display code example (useful for creating code for terminal output for a debug console) I'd be quite frustrated.

    Anyway, the problem looks to be something related to networking, a local server not starting due to a failure to create a loopback to localhost.

  • The problem turned out to be the Killer Control Center application (and possibly the Killer Network Service). This "Killer" stuff is an application-to-IP connection prioritization and throttling package. It is not supposed to act as a blocking firewall, and has shown not problem with other applications. But apparently it does not cooperate well with CCS. I suppose this must have something to do with [Killer] not correctly working with local server processes.

    After ending the Killer Control Center process and stopping the Killer Network Service, all three of these web-delivered services now function as expected.