This thread has been locked.
If you have a related question, please click the "Ask a related question" button in the top right corner. The newly created question will be automatically linked to this question.
Tool/software: Code Composer Studio
Hi. there.
I have an AM3359ICE and J-Link Debugger.
When debugging in CCS, "no symbols are defined" is displayed and tracing can not be done.
Previously, debugging was normal.
Did I misconfigure something?
Step :
1. J-Link Connect.
2. USB Connect.
3. Power On.
4. Run CCS
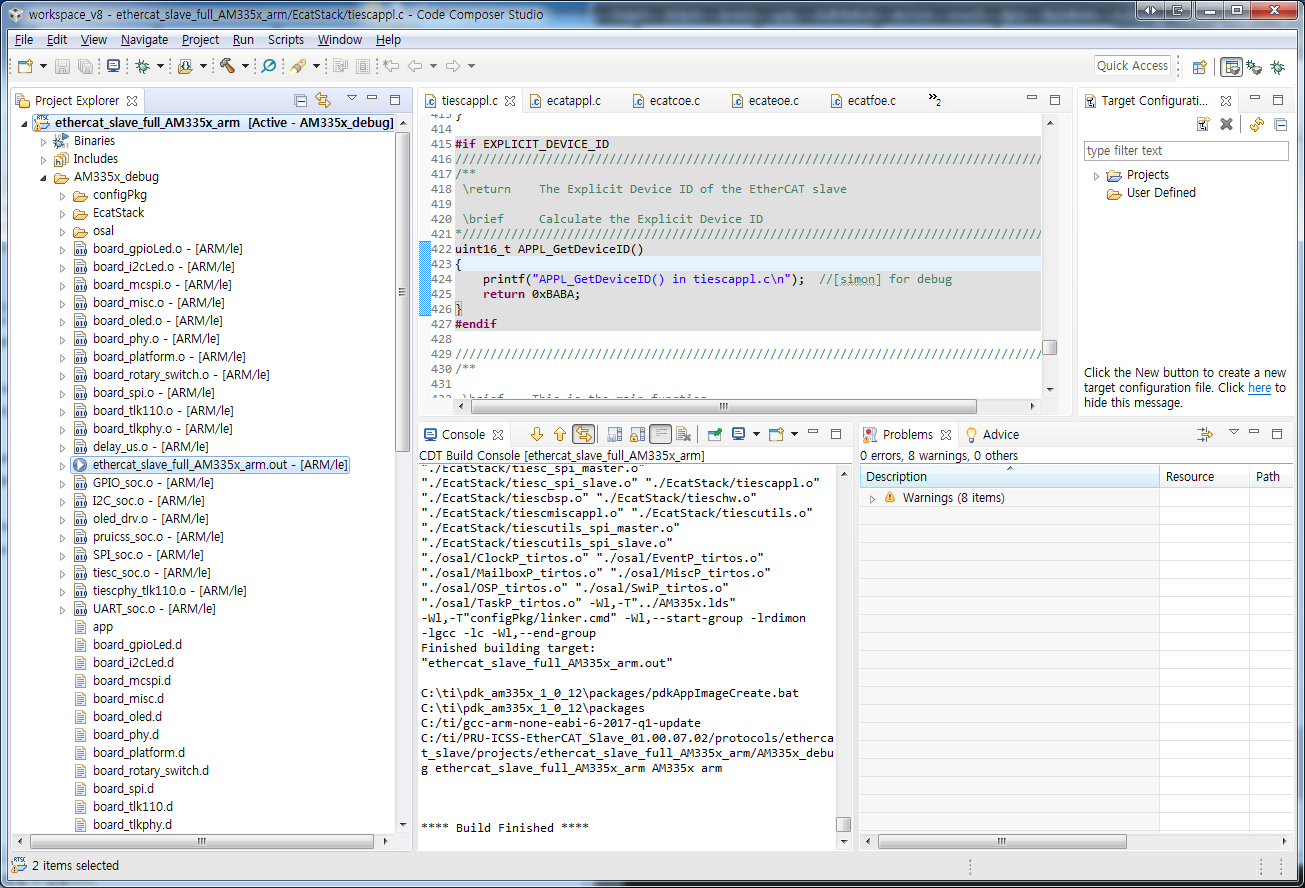
5. Build ethercat_slave_full_AM335x_arm
6. Run > Debug
Screenshot :
1. Run Build Project
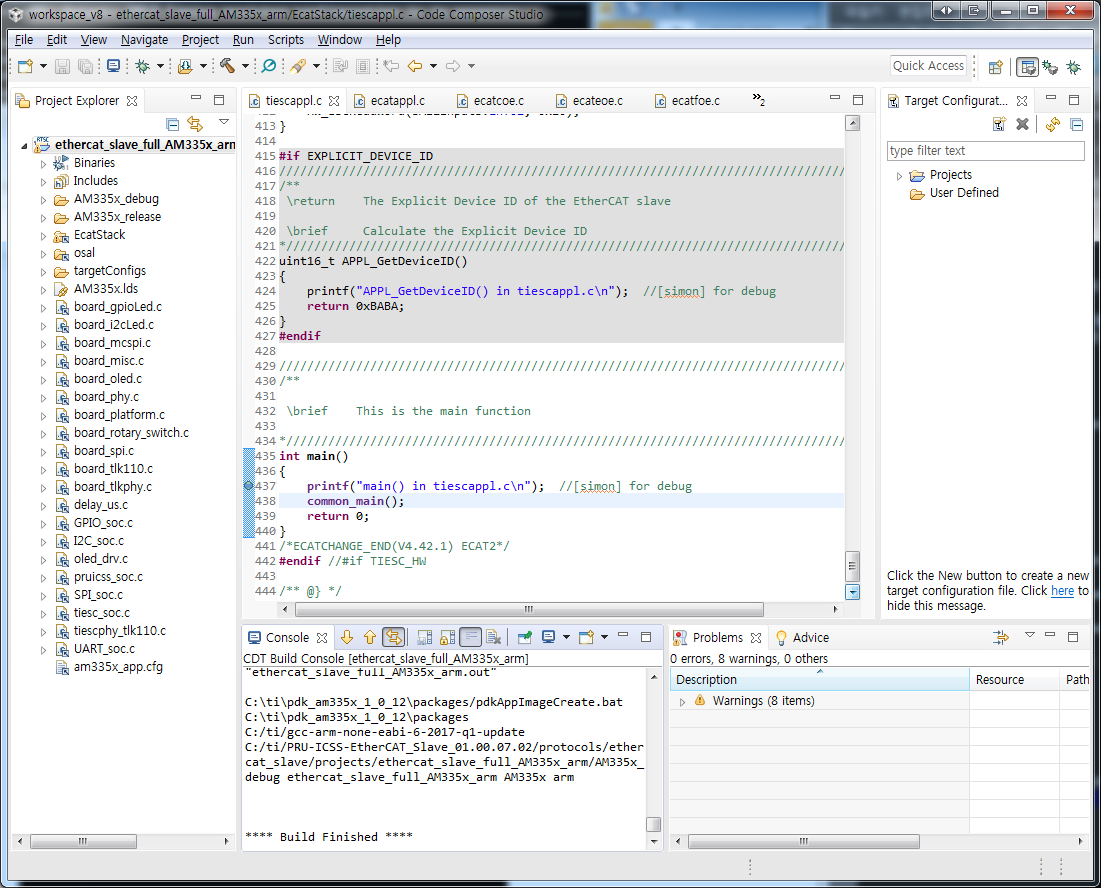
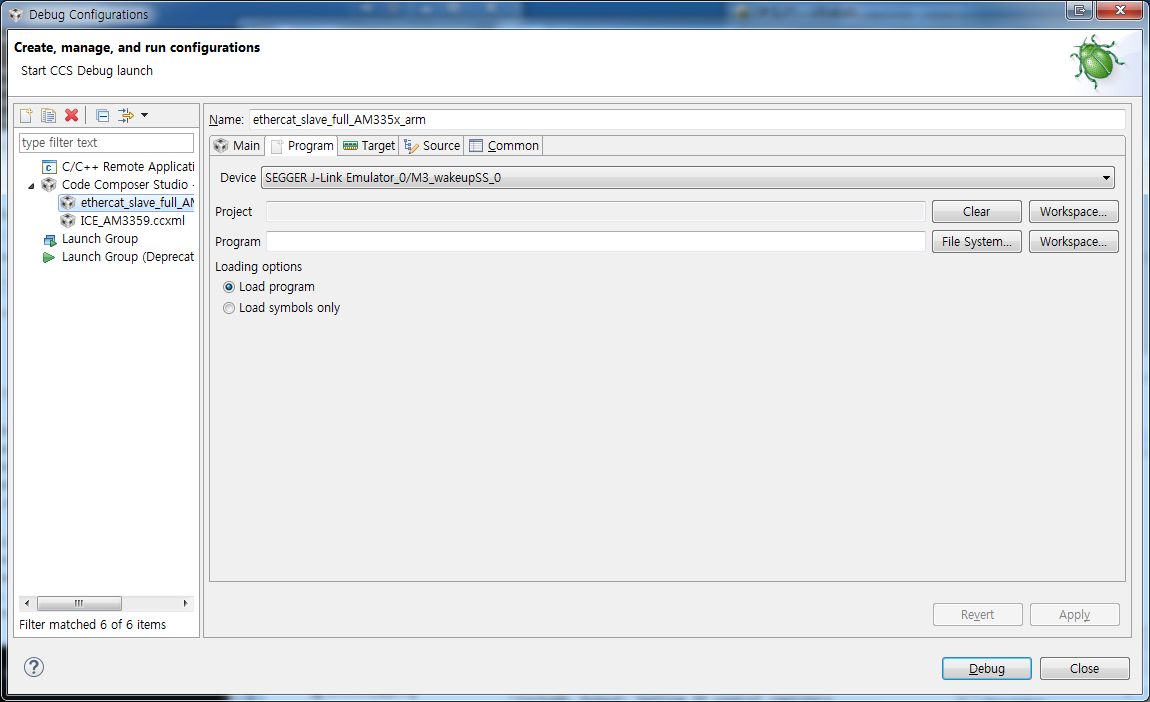
3. Console Log
4. Debug Configurations
Thank you in advance.
Hi. Rafael
Thank you for your reply.
I have confirmed what you have told me.
But it is still not debugging.
====================================================================
At first I woudl check if the code is being built with debug symbols - this may be one of the changes that inadvertently may have happened.
=> Active debug mode
Another detail is to actually verify if the code is actually loaded to the target. The disassembly seems to indicate there is valid code there, but I can't tell for sure if it is the exact same executable.
Check the section "Debugging Library Code" of the Debug User's Guide for details about this particular message and ways to explore workarounds about it.
software-dl.ti.com/.../ccs_debug-main.html
=> Dubug configuration
=> ccxml
====================================================================
Thank you in advance.