This thread has been locked.
If you have a related question, please click the "Ask a related question" button in the top right corner. The newly created question will be automatically linked to this question.
Tool/software: Code Composer Studio
Hello,
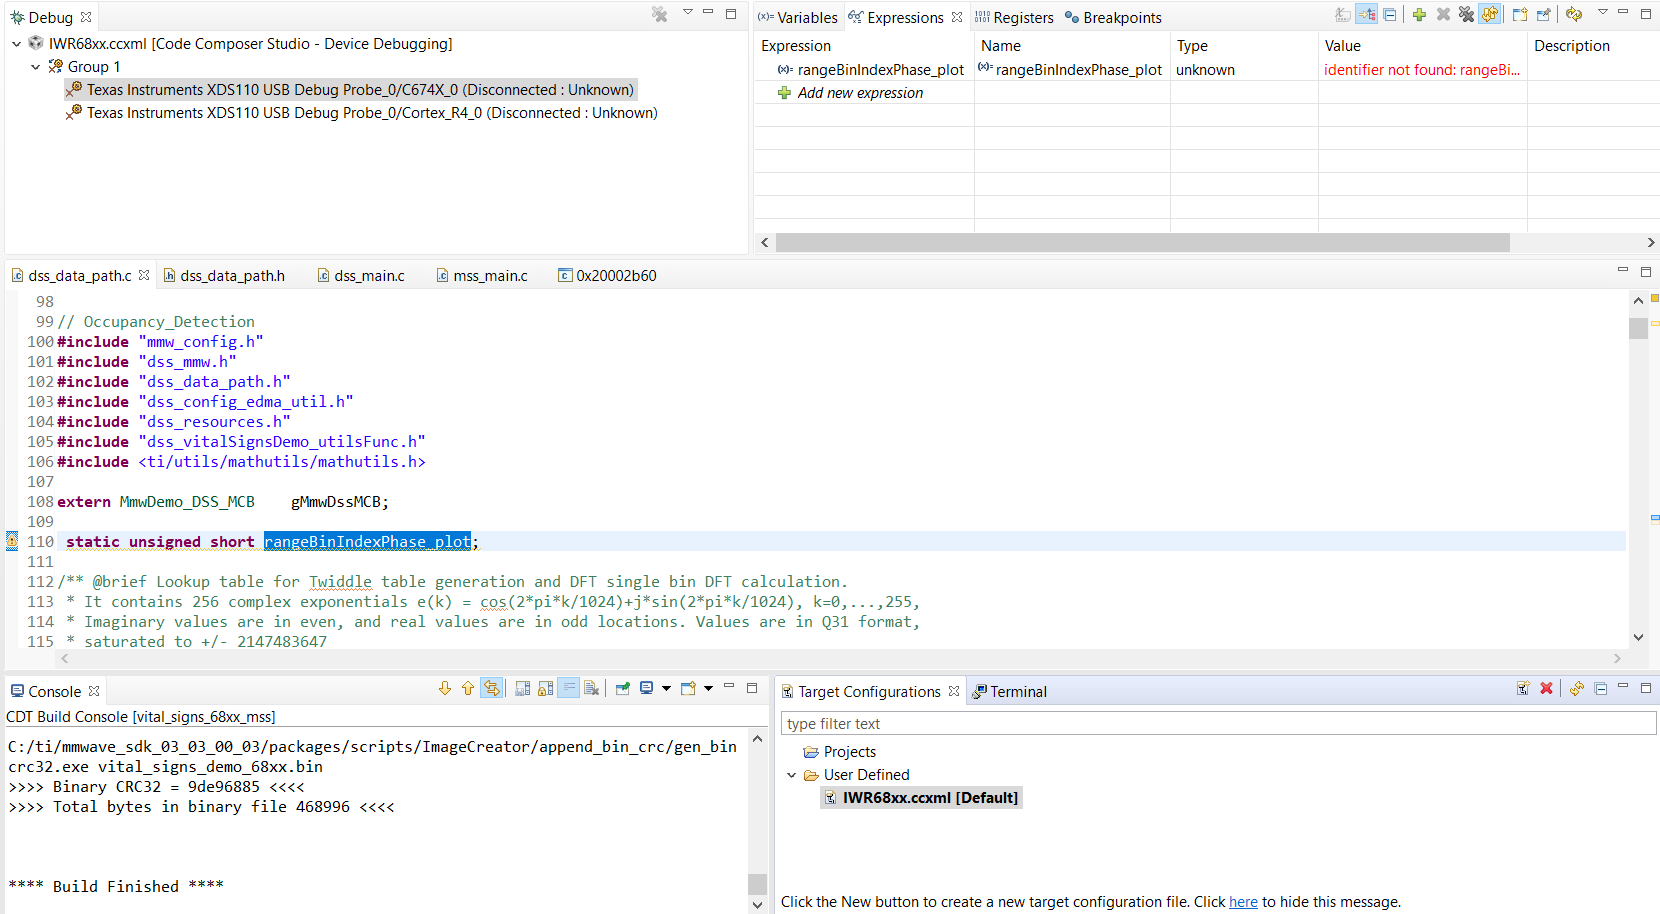
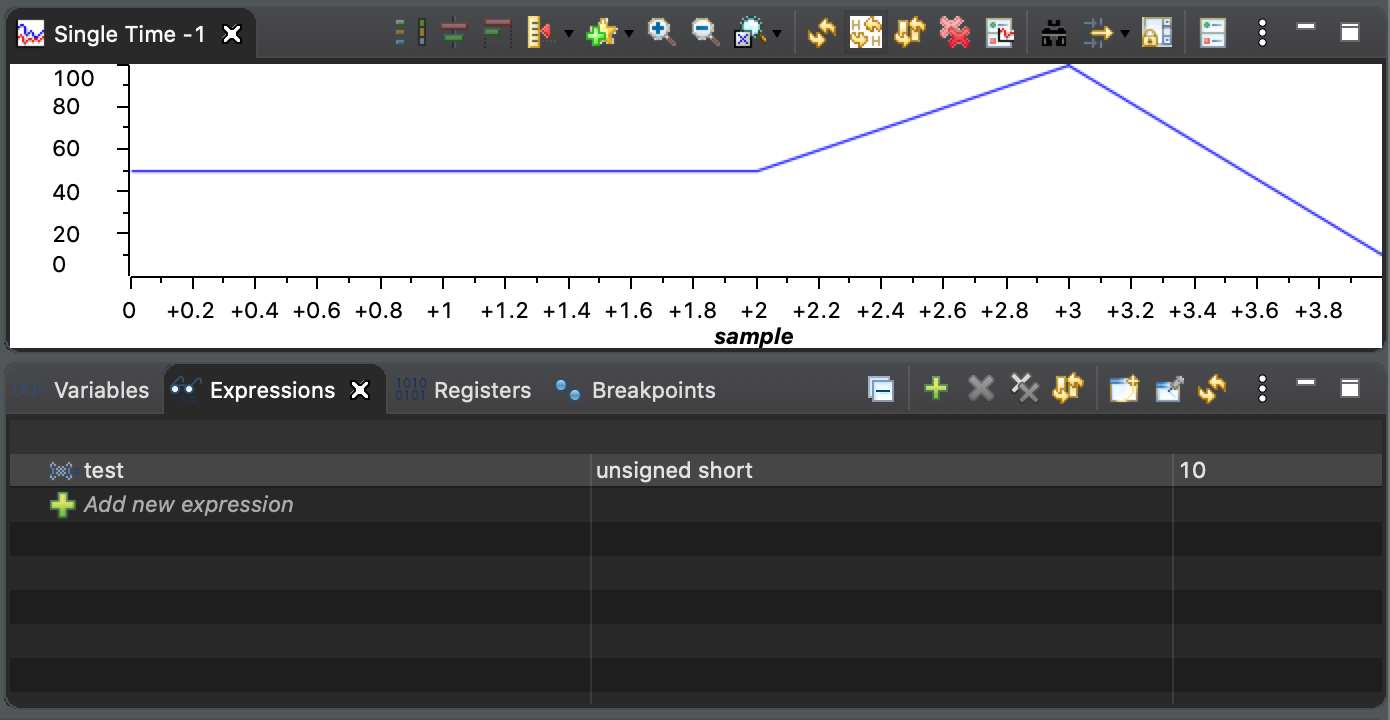
I am trying to add a global variable to the watch expressions list, so I could be able to plot a graph using this expression but I always get an unknown type and identifier not found errors. I already turned the compiler optimization off and still, it didn't fix the problem. Any suggestion on how I can fix that?
Thank you in advance.
Best regards,
Tassneem
Tassneem,
Looking at the Debug view I can see that you are not connected to the device and no symbols are loaded. Thus CCS has no idea what global variables are valid.
You have to be connected to the device and have the program loaded. You can click on the the "connect" button on the toolbar to connect to the selected core on the device. Then you can click on the load button to load the appropriate program.
Normally when you start a debug session for a project it will do all of that automatically. If you manually start your own debug session then you will have to manually complete those steps
Regards,
John
Tassneem,
Does the variable get used in the application at all?
If I add a similar global variable to my application
volatile unsigned short test;
But if I never initialize it then I see the same behaviour.
If I initialize it in my application then I can see it
This is with compiler optimization as I believe the linker will still remove unused variables.
Regards,
John
Hi John,
Yes, it is used. Actually, I tried now to remove the static identifier and it finally works for some reason, but when I right-click on the watch expression and click on the graph option, nothing actually happens. I saw some videos online and at this step, an empty graph should appear in the window, but for me, nothing happens, do you have any idea why?
Best regards,
Tassneem
Are you able to open the graph from the Tools -> Graph menu?
Also the graph might be opening in a collapsed window group. I can see that there are some windows collapsed into quick view on the right hand side (looks like the memory browser and something else). I can't see the left side of your CCS but it could be there. If so there woudl be an icon that looks like the bottom one here:
John
John,
Yes, I am able to open it from the Tools -> Graph menu, but I'm not able to open it for a certain expression from the expressions drop-down menu.
I check all my collapsed windows and there is nothing.
Best regards,
Tassneem
For me sometimes I get the context menu item to open a graph and sometimes I don't. I would just use the Tools menu.
Regards,
John
If you click the refresh button manually when halted does it show the value?
For example if I have my variable in the expressions view. Change the value and click refresh in the graph it will update with the value. Here I entered 50, refresh, 100, refresh, 10, refresh
I just want to see if the graph is connected to the variable ok.
See CCS/CC2640: How to view static variable for how to make the expression view in the debugger display a static variable.Tassneem Helal said:I tried now to remove the static identifier and it finally works for some reason
Hi Tassneem,
Tassneem Helal said:I have tried what you said, but as you see from my screenshot the value in the graph does not get updated according to the value in the watch expression tab, so what could be the problem here?
Can you try closing the graph and reconfiguring/reopening it? I find the graph functionality to be a little flakey sometimes and reopening the graph often does the trick
Thanks
ki
Yeah, the continuous refresh button was clicked. I closed the graph and reopened it and somehow it finally worked. Thank you so much fro your help and support!
Best regards,
Tassneem