

Thermal noise in analog design is almost always parasitic and should be avoided at all costs. Input filtering, PCB layout and grounding are paramount to good analog system designs, but you’ll always find some amount of thermal Johnson-Nyquist and flicker noise in an analog system.
An additional noise source, quantization noise, can actually outweigh the noise from thermal and other noise sources. Quantization occurs when the signal converts from analog to digital.
Figure 1 shows the quantization noise resulting from an extreme example of a 4-bit analog-to-digital converter (ADC) digitizing a sine wave.

Figure 1
When you use a ruler to measure an object, you actually count the marks on the ruler to measure the size of the object, right? What happens when the object’s size is between two markings? If you’re forced to make a decision between two of the ruler marks, you’ll choose the one that’s closest to the actual size of the object. The difference between that, and rounding to the nearest tick mark, is a physical representation of quantization noise.
All ADCs do this with the voltages connected to their inputs. They look at the signal and approximate the actual voltage into a finite number of steps. The number of usable steps in an ADC determines the resolution.
The noise shaping characteristics of high-precision delta sigma ADCs generally minimizes thermal and flicker noise. In the case of 16-bit and lower devices, thermal noise can become much less than the error due to the approximation of the signal.
In ADCs like these, you may find almost no change in digital codes at low data rates. We almost exclusively see quantization error in the actual signal as the device reads it.
That’s enough performance for many applications. However, we can improve quantization noise and achieve better than 16-bit resolution, even though we only have a 16-bit ADC.
How? Add noise, of course!
By adding statistically random or Gaussian noise to the input of an ADC, the LSB will start flickering. This is known as dithering. If we average the flickering over a series of readings, the result is closer to the actual value than a lower noise front end that is causing no change in codes.
A great way to do this is to increase the sample rate of a 16-bit ADC until the LSB begins to flicker. Figure 2 provides an example of this. The increased noise allows averaging to create a more accurate result, while still delivering the same throughput.
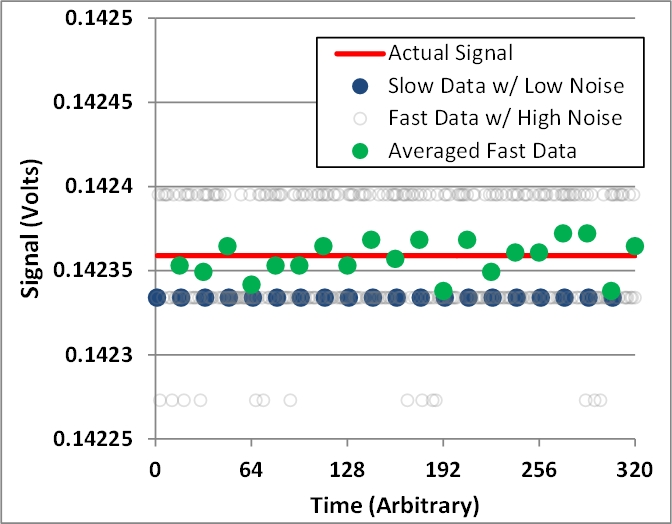
Figure 2
Performing the averaging math is simple. For example, when using the 16-bit ADS1118 at 8 samples-per-second, most systems yield a stable result with no digital code changes. In this case, our error is dominated by quantization noise. However, if the device runs at 128 samples-per-second, there is enough noise to create digital codes varying between each other.
To average these 16 samples in an MCU, accumulate all of the results as they come in. The division is easy after that because the number of samples is a power of 2. Simply rotate the result to the right four times. These extra 4 bits are usable resolution. Same data rate, with more resolution because of a little noise.
How cool is that?!?
-

Dawea Wang
-
Cancel
-
Up
0
Down
-
-
Reply
-
More
-
Cancel
Comment-

Dawea Wang
-
Cancel
-
Up
0
Down
-
-
Reply
-
More
-
Cancel
Children