A related question is a question created from another question. When the related question is created, it will be automatically linked to the original question.
If you have a related question, please click the "Ask a related question" button in the top right corner. The newly created question will be automatically linked to this question.
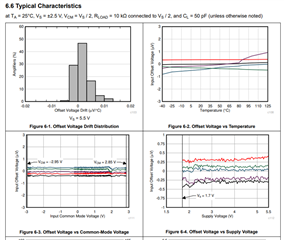
yes, five typical and representative samples are shown to demonstrate what variance of data is to be expected. But please note, that the graphs only show typicals. Some outliers can exceed these curves. So there's no guarantee that all samples are within these curves. Maximum specifications are given in table 6.5.