Hello
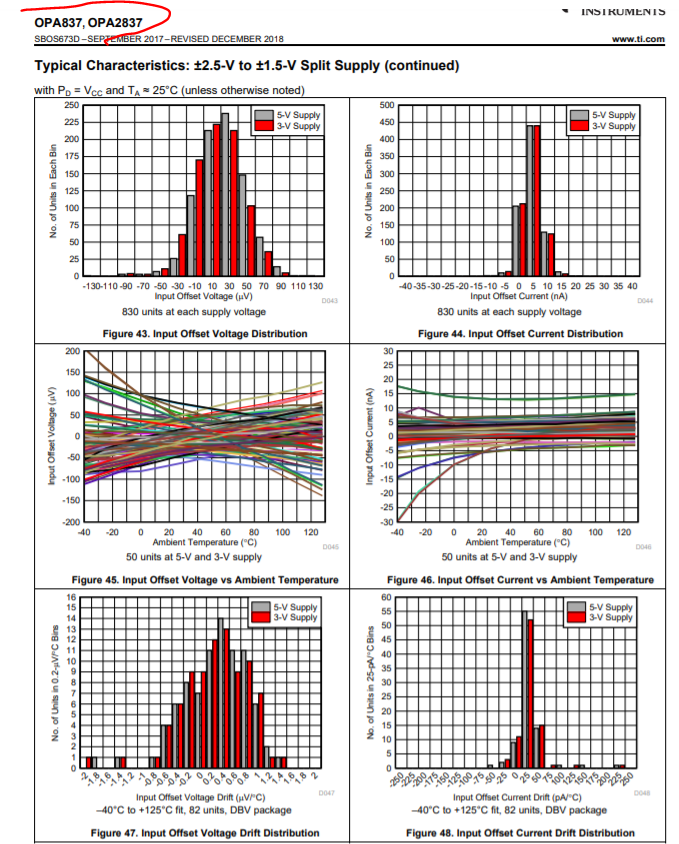
I received a reply to the scatter diagram of Input Offset Voltage from TI Customer Center as follows.
CS0219668
Nice to talk about this issue with you here.
Typical means the +-1 sigma(68.27%) in Gaussian distribution. And max and min usually comes +-3 sigma or 4 sigma. That's to say if you have 100 pcs in hand, at least 68 pcs, are at within 0.7mV, and for others within 5mV.
Unfortunately, for this data only the Gaussian data is provided. Hope this could help you.
I Request a detailed scatter plot for 31.73% except +-1 sigma (68.27%).
Best regards.