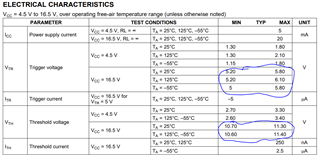
The SE555-SP datasheet shows that the device has trigger and threshold voltage characterized at several supply voltages and temperatures, but there is no information on what is driving these variations. If possible, I would like the following info:
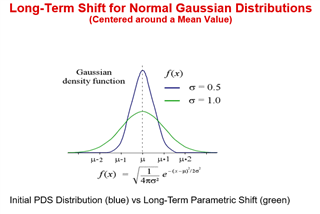
- The contribution of the Trigger/Threshold voltage range due to static errors (e.g. resistor tolerance or comparator tolerance)
- The contribution of the Trigger/Threshold voltage range due to the effects of drift (e.g. temperature or aging effects)
My operating voltage is ~8.2V, which, looking at the tables, would give me around +/-10% bound on the Trigger voltage, and ~+/-5% on the Threshold voltage. A little more insight into where these values come from would be helpful for determining whether this IC can be used in our application.
Thanks,
Ben