I'm trying to make the Stellaris In-Circuit Debug Interface work on a Tiva C TM4C1294 Connected LaunchPad from Code Composer Studio 6.0.1 in Ubuntu 12.04 where the used compiler is GNU v4.7.4 (Linaro).
I have made a simple CCS Project and chosen to "Reset target during program load to Flash memory" under the Project Properties -> Debug -> Flash Settings.
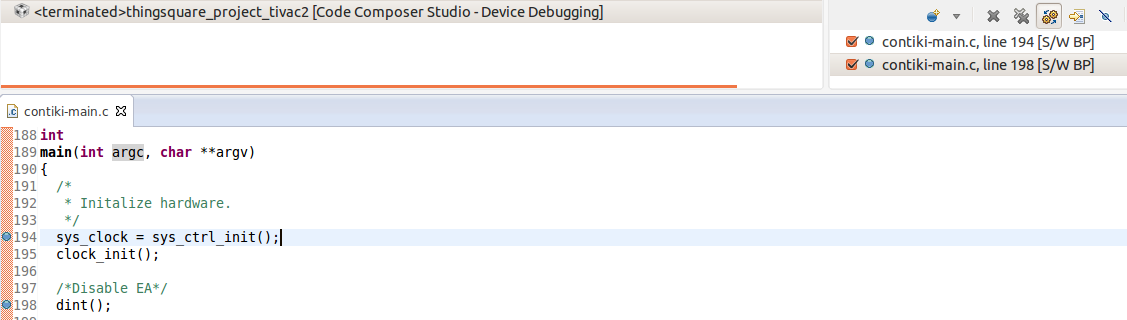
The problem is that I'm unable to make it stop at a breakpoint.
The exact same scenario have I tried from windows, where it successfully stops at the desired breakpoint.
Do you have an idea what might cause the problem?
Thanks, Jesper