This thread has been locked.

If you have a related question, please click the "Ask a related question" button in the top right corner. The newly created question will be automatically linked to this question.

TIVA SYS/BIOS FPU context switch corruption with zero latency interrupts

Other Parts Discussed in Thread: EK-TM4C1294XL, SEGGER, SYSBIOS, TM4C1294NCPDT, CC2650

Hi,

I was implementing three 200kHz Buck convertors. Each Buck is phased shifted and runs every 5us and uses a zero latency interrupt from the ADC to run a fixed point 3p3z controller (software optimized). Every 10ms a SWI timer is run to calculated floating point values for soft start. The idle task just flashes a LED and performs TCP/IP and USB communications.

But I found my SWI function was sometimes hitting some of my asserts. When I looked at “ret” it was between 0 and ADC_VALUE_MAX, or it was “NaN”.

    if (ret >= 0.0f && ret <= ADC_VALUE_MAX)
    {
    	//ok
    }
    else
    {
        assert(ret >= 0.0f && ret <= ADC_VALUE_MAX); //hits this line
    }

At first I though it was because I was using floats in my HWI Buck function, so I re-wrote it to use integer maths only.

Then I realized I had to mark the HWI Buck function as “__interrupt” for the correct context saving to occur.

I’ve done all of this and still my SWI function was being corrupted so I decided to write a small test program to reproduce this error. This code doesn’t perform the buck or soft start code, but contains the bits of code that seems to cause the error. I made the SWI code run for almost 10ms and changed the HWI to run just one buck every 5us.

My test (context.zip) program uses the following version of compiler, RTOS, XDC

context.zip

  • Compiler version TI v5.2.2
  • TI-RTOS for TivaC 2.14.4.31
  • XDCtools version: 3.31.1.33_core

 It has two files,

  • Empty.cpp - the idle task and SWI function
  • Isr.cpp – stripped down buck code

You just need to add a break point to empty.cpp at line 50 and run. This break point should be hit and you can see either you have a NaN or ret is within range.


assert(ret >= 0.0f && ret <= ADC_VALUE_MAX);

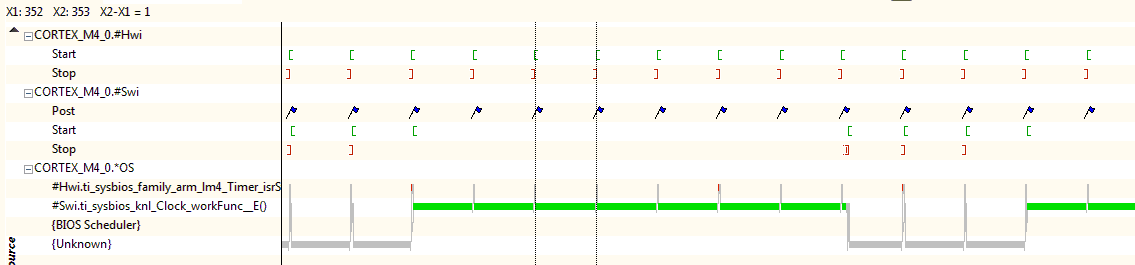
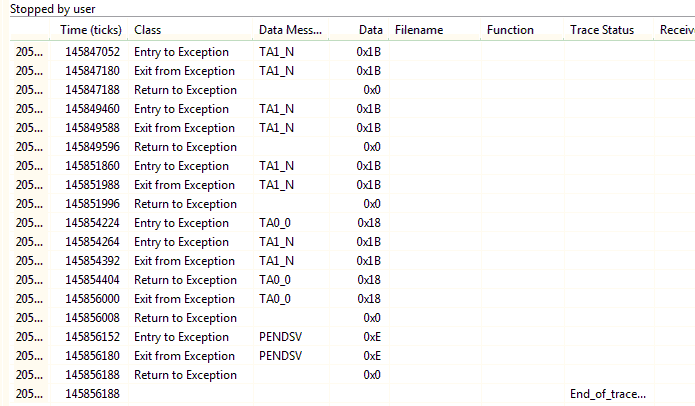
If you have a ETM then it should be very easy to see how the SWI is being corrupted, but I don’t have one ;-(

So far my possible thoughts are

  • The HWI interrupt isn’t saving/restoring its context correctly, but the ASM looks ok, and I would have thought every other ARM developer would have spotted this compiler error by now.
  • The SYS/BIOS is doing something strange and relies on a set of sequential ASM instructions that are being interrupted by my HWI. This might sound strange but I found this bit of code in Hwi_asm.sv7M. (not that I’m saying this code has anything to do with my problem)


; CAUTION!!! Do NOT single step thru the next instruction
; else, the processor won't arrive at pendSV thru the
; exception mechanism.
       msr     basepri, r0     ; causes pendSV to happen
       nop                     ; 2 nops required for prefetch
       nop                     ;
       .endasmfunc
  • Or I'm doing something wrong in setting up my HWI

I found that by changing bits of my code I can cause the corruption not to be detected. But I think this just hides the corruption, so I really want to know what is going wrong and not to change my test program to get it working (unless it’s a sys/bios patch)

Any help in this matter would be greatly appreciated.

Chris

  • Chris, I've not run across this terminology for Cortex micros before, what do you mean by zero latency interrupt?
     
    Robert

  • One suspects that the good doc meant, "Near or driving towards Zero."

  • Could be, although considering the wording and the source I was expecting more precision to the terminology.

    Robert
  • hi,
    I copied the terminology from this wiki page

    processors.wiki.ti.com/.../BIOS_for_Stellaris_Devices

    It's basically a non-handled interrupt, eg one that doesn't go through the sys bios. I found that when I used a HWI interrupt with a priority of non-zero (eg a handled interrupt) then sys/bios was actually called first, which then called my HWI function. This added too much delay and jitter. When you use a HWI with a priority of zero then it changes the interrupt vector to point directly to your HWI function.

    cheers
    chris
  • OK, just an interrupt then. Although I don't know what priority has to do with it. Sounds like Sys/Bios is interfering. Are you setting up vectors in the interrupt table at compile time or via run-time calls?

    The __interrupt keyword is probably not applicable for Cortex devices. Best case is it should declare an error, worst case should be it does nothing but.... Most context is saved by the hardware with the exception being floating point. I don't use floating point usually in embedded except for presentation but there are options for turning on preservation of the floating point registers (not normally saved) TivaWare has them documented in the FPU section of the users guide.

    You may want the lazy version although it's likely to introduce jitter.

    Robert
  • hi,

    I use Sys/Bios to set up the HWI as shown below

    	Hwi_Params hwiParams;
    
            Hwi_Params_init(&hwiParams);
    	hwiParams.priority = 0;  //0 = non-handled, non-zero = Sys/Bios handled
    	hwiParams.enableInt = true;
    
    	Hwi_create(INT_PWM0_0, (Hwi_FuncPtr)HwiPwmFunc, &hwiParams, NULL);

    And I set up the SWI (that is being corrupted)  as shown below

        Clock_Params clockParams;
    
        Clock_Params_init(&clockParams);
        clockParams.period = 10;
        clockParams.startFlag = true;
        Clock_create(SwiClockFunc, 10, &clockParams, NULL);

    I think Sys/Bios might be using a 1 ms system timer interrupt which interrupts my SWI, and it's somehow not restoring its context when my HWI interrupts it. But I'm only guessing.

    The Sys/Bios saves the FPU registers for me, so I don't need lazy interrupts, and Sys/Bios didn't work for me when I turned it on, and I read somewhere it doesn't work with it anyway. I'm not using FPU in my HWI and the core auto saves CPU registers and the HWI code also saves some more CPU registers, so I don't think it's the HWI code.

    I think it's an error in the Sys/Bios code.

    cheers

    Chris

  • Christopher Hossack said:
    I think Sys/Bios might be using a 1 ms system timer interrupt which interrupts my SWI, and it's somehow not restoring its context when my HWI interrupts it.

    Unless the timer uses floating point that shouldn't matter I don't think. The rest of the context is saved and restored in hardware

    There is a possibility That if you are using a pre-compiled library there is a calling convention difference.. Floating point emulation might make use of the registers differently too, in which case the entire sys/bios would have to be compiled to support it.

    Might be an unprotected critical section in your code. I'd lean towards a mismatch between the sys/bios library and your compiler settings if it comes precompiled and you're using it that way.

    I don't suppose you have trace capabilities?

    Robert

  • hi,

    Unless the timer uses floating point that shouldn't matter I don't think. The rest of the context is saved and restored in hardware

    I don't think it's a standard register context save problem. As you say R0/1/2/3/12 LR,PC,xPSR are automatically handled for you.

    There is a possibility That if you are using a pre-compiled library there is a calling convention difference

    I've created the project using CCS, and as far as I know it's using the correct library. eg I haven't been given any option to change the library. And it all works fine, unless I bombard Sys/Bios with my HWI.

    Might be an unprotected critical section in your code

    I think it's a unprotected section in the Sys/Bios, but I'm hoping TI will have a look since it they know a lot more about it than me.

    I don't suppose you have trace capabilities?

    No. The cheapest one I found is ULINKpro for £1000, and my dev board EK-TM4C1294XL doesn't have the correct connector either ;-(. With a ETM I could quickly see who's corrupting the SWI.

    cheers

    Chris

  • I've not used trace but the Embedded Trace Buffer (ETB) appears to offer it through the SWO interface.

    Segger's Jlink line appears to support that but I don't know how much extra support is needed in your debugger to actually log it. I don't know how close it gets to full trace since it has a lower bandwidth but it may be sufficient.

    Also take a look at Segger's SystemView, maybe it can help trace context switching for you.

    I ran into a similar issue on another processor years ago and it took a long time and a trace to find since it was hard to trigger.

    Robert
  • I'm able to report past "trace" success using J-Link via SWO - but operated under the IAR IDE and w/out the (potential) impact of (any) RTOS.   (thus - my report is far from poster's plight - yet (may) suggest a pathway)

    Note that should budget be an issue - the J-Link may be purchased at (astoundingly) low-cost (EDU version) - which matches the standard - AND you do not even have to "feign" student status.   (just don't use for professional development...)

    I wonder if you could "limit" the reach & extent of the RTOS - and via repeated test & observation - identify that (offending) portion of the RTOS which (appears) to wreak such damage...

  • ; CAUTION!!! Do NOT single step thru the next instruction
    ; else, the processor won't arrive at pendSV thru the
    ; exception mechanism.
           msr     basepri, r0     ; causes pendSV to happen
           nop                     ; 2 nops required for prefetch
           nop                     ;
           .endasmfunc

    I don't understand the comment in the code you posted. Why would single-stepping that instruction cause a pendSV? I have that line of code in my RTOS and I single step it without causing any weirdness like a pendSV. If you figure this out, please post a followup.

  • Thinking about this some more, what I think the author of this code meant is that the change to basepri possibly lowers the interrupt priority lower than the priority of the pendSV interrupt and that this allows the pendSV to occur. Again, I don't see how this is an issue--it works correctly in my debugger.
  • hi,

    I'm not sure what this piece of code is doing, but I don't think it's the problem. I was just highlighting the fact that the author didn't want that piece of Sys/Bios code interrupted.

    When I look at the Execution graph I can see the system is being interrupted every 1ms by the system tick HWI and 1ms SWI Post.
     You can also my SWI running for about 7ms which gets corrupted.

    What isn't shown is my zero latency (eg non-handled Sys/Bios interrupt) which is running every 5us. I think my HWI is interrupting the 1ms system tick HWI which is doing something naughty and relies on the fact that it's code doesn't get interrupt, eg something like the code example I posted.

    So I think I will look at ti_sysbios_family_arm_lm4_Timer_isrStub__E (#defined to Timer_isrStub) to see what it's doing.

    cheers

    Chris

  • Hi,

    sorry, but I missed these comments. I've ordered a J-Link, but while I'm waiting it looks like the XDS100 should work with ETB  according to the TI web site (Embedded Trace Buffer - "User can connect, setup ETB and collect via a XDS100, XDS200, or XDS560 class JTAG emulators"), but it doesn't ;-(

    I've raised this issue (Can not use the Embedded Trace Buffer (ETB) on a TIVA TM4C1294NCPDT with a xds100v2 JTAG)in a hope for an answer.

    cheers

    Chris

  • Christopher Hossack said:
    I've ordered a J-Link

    Sorry to only say this after you have ordered a J-Link, but since you are using CCS you won't be able to use the SWO trace facilities since the http://processors.wiki.ti.com/index.php/J-Link_Emulator_Support which was added for CCS 5.2 only supported basic debug functionality.

    As of CCS 6.1.2 there is no J-Link support for SWO trace, in that when I attempted to enable Statistical Function Profiling with a TM4C1294NCPDT connected with a Segger J-Link set to use SWD communication got a The specified breakpoint type "Trace" does not exist on this target error.

    Full J-Link support for CCS is planned for CCS 6.2 - see https://www.segger.com/ti-code-composer-studio.html

     Edit: Re-word as not sure which version of CCS is in use.

  • We note that past suggestions (by two here) mentioned J-Link AND the superior IDE - IAR.

    "Sorrow" is (really) not any requirement as J-Link supports multiple ARM MCUs (vast number of vendors) and out-performs those JTAG probes normally used here...

    In time - poster will likely (graduate) to the faster, feature laden MCUs which encompass M0, M3, M4 & M7 - all supported by the top selling, J-Link...

  • Christopher Hossack said:
    • Compiler version TI v5.2.2
    • TI-RTOS for TivaC 2.14.4.31
    • XDCtools version: 3.31.1.33_core

     It has two files,

    • Empty.cpp - the idle task and SWI function
    • Isr.cpp – stripped down buck code

    You just need to add a break point to empty.cpp at line 50 and run. This break point should be hit and you can see either you have a NaN or ret is within range.

    I can repeat the failure, using the following:

    • Compiler version TI v5.2.7
    • TI-RTOS for TivaC 2.14.4.31
    • XDCtools version: 3.31.1.33_core

    i.e. the same TI-RTOS for TivaC and XDCtools versions, but a later compiler version. The reason is that I didn't have Compiler TI v5.2.2 installed and the CCS updates wasn't showing that exact compiler version as available.

    I found that the failure still occurred if changed to use the "latest" TI-RTOS for TivaC 2.16.0.8, i.e. the problem hasn't been fixed by any TI-RTOS updates.

    Will attempt to determine the reason for the failure.

    Note that I don't have any trace available, as are using a Stellaris ICDI to debug.

    [I did attempt to use the XDS110 debug-out on a CC2650 Launchpad but while I could enable SWO trace in the CCS 6.1 debugger was unable to actually capture any SWO trace data]

  • Christopher Hossack said:
    You just need to add a break point to empty.cpp at line 50 and run. This break point should be hit and you can see either you have a NaN or ret is within range.

    I also noticed that after that break point had been hit, if the target was set running again ended up with a Hard Fault.

    Rather than set the break point on empty.cpp line 50 I enabled a break point on any Error under any ARM Advanced Features:

    This triggers a break point on the first line of ti_sysbios_family_arm_m3_Hwi_excHandlerAsm__I, with a Hard Fault due to a "Invalid State Usage Fault". When the Hard Fault occurred the RTOS Object Viewer reported that the Hwi stack had overrun:

    I tried increasing the HWI stack size from 768 to 4096 bytes, but the failure symptom changed to a SYS/BIOS assertion failure:

    Starting the example
    System provider is set to SysMin. Halt the target to view any SysMin contents in ROV.
    ti.sysbios.gates.GateMutex: line 99: assertion failure: A_badContext: bad calling context. See GateMutex API doc for details.
    xdc.runtime.Error.raise: terminating execution

    The stack backtrace is:

    context [Code Composer Studio - Device Debugging]	
    	Stellaris In-Circuit Debug Interface_0/CORTEX_M4_0 (Suspended)	
    		loader_exit() at exit.c:52 0x00007608 	
    		abort() at exit.c:117 0x00007612 	
    		xdc_runtime_System_abort__E(unsigned char *)() at System.c:100 0x0000874C 	
    		xdc_runtime_Error_policyDefault__E(struct xdc_runtime_Error_Block *, unsigned short, unsigned char *, int, unsigned int, int, int)() at Error.c:165 0x0000394E 	
    		xdc_runtime_Error_raiseX__E(struct xdc_runtime_Error_Block *, unsigned short, unsigned char *, int, unsigned int, int, int)() at Error.c:114 0x000086F8 	
    		xdc_runtime_Assert_raise__I(unsigned short, unsigned char *, int, unsigned int)() at Assert.c:34 0x000070CC 	
    		ti_sysbios_gates_GateMutex_enter__E(struct ti_sysbios_gates_GateMutex_Object *)() at GateMutex.c:101 0x00004520 	
    		ti_sysbios_BIOS_rtsLock__I() at empty_pem4f.c:2,581 0x000083F6 	
    		fputs(unsigned char *, struct <unnamed> *)() at fputs.c:98 0x00003526 	
    		_abort_msg(unsigned char *)() at assert.c:67 0x00007F38 	
    		GetAdcIvalue(float)() at empty.cpp:52 0x00004DC4 	
    		SwiClockFunc(unsigned int)() at empty.cpp:90 0x000073D8 	
    		ti_sysbios_knl_Clock_workFunc__E(unsigned int, unsigned int)() at Clock.c:266 0x00002BB2 	
    		ti_sysbios_knl_Swi_run__I(struct ti_sysbios_knl_Swi_Object *)() at Swi.c:118 0x000030BC 	
    		ti_sysbios_knl_Swi_restoreHwi__E(unsigned int)() at Swi.c:404 0x00005A28 	
    		ti_sysbios_family_arm_m3_Hwi_doSwiRestore__I(unsigned int)() at Hwi.c:1,467 0x00008D16 	
    		ti_sysbios_family_arm_m3_Hwi_dispatch__I() at Hwi_asm.sv7M:182 0x0000415A  (ti_sysbios_family_arm_m3_Hwi_dispatch__I does not contain frame information)	
    

    The stack backtrace doesn't seem to make sense, since can't see where the GetAdcIvalue can call _abort_msg(). Suspect there is some sort of memory overwrite occurring. 

  • Chester Gillon said:
    The stack backtrace doesn't seem to make sense, since can't see where the GetAdcIvalue can call _abort_msg(). Suspect there is some sort of memory overwrite occurring.

    My previous analysis was incorrect. What was happening was that GetAdcIvalue was using assert() to report a failure, where the assert macro called _abort_msg(). It was calling _abort_msg from an interrupt context which caused the ti.sysbios.gates.GateMutex assertion failure, HWI stack overrun and then Hard Fault.

    When GetAdcIvalue() was changed to increment a global variable to indicate a failure, then the test continued to run without suffering a Hard Fault. The RTOS Object Viewer then showed that the hwiStackPeak was 520 and hwiStackSize 768. i.e. the HWI stack is no longer overrunning.

    More analysis required into the root cause.

  • hi,

    Following your investigation I also upgraded my environment to

    • Compiler version TI v5.2.7
    • TI-RTOS for TivaC 2.16.0.08
    • XDCtools version: 3.32.0.06_core

    and changed the assert to modify a global variable, eg

    int ErrCount = 0;
    
    uint32_t GetAdcIvalue(float Value)
    {
    	float ret;
    	ret = Value / m_ScaleI;
    
        if (ret >= 0.0f && ret <= ADC_VALUE_MAX)
        {
        	//ok
        }
        else
        {
        	ErrCount++;
            //assert(ret >= 0.0f && ret <= ADC_VALUE_MAX);
        }
        return (uint32_t)ret;
    }

    The ErrCount++ was still hit, indicating corruption was still occurring. But at least now the assert wont confuse the issue.

    Thank you for looking this. I've been bashing my head against a wall for ages and a fresh point of view is always helpful.

    I think the problem is with Hwi_asm.sv7M::ti_sysbios_family_arm_m3_Hwi_dispatch__I, which is called by the HWI 1ms tick timer. I need to step through it one asm instruction at a time and see what its doing, but there is a lot there I just understand., eg Why does this function check which stack the IRP is on? Shouldn't the hardware store the IRP or the handler code just push it anyway?

    ti_sysbios_family_arm_m3_Hwi_dispatch__I:
            .asmfunc
    
    ;
    ; get IRP
    ; If this hwi switched to MSP then IRP is on PSP stack
    ; else if this is a nested interrupt then IRP is on current MSP stack
    ;
            tst     lr, #4          ; context on PSP?
            ite     NE
            mrsne   r1, psp         ; if yes, then use PSP
            moveq   r1, sp          ; else use MSP
            ldr     r0, [r1, #24]   ; get IRP (2nd of 8 items to be pushed)

    At this level I still have lots to learn ;-)

    cheers

    Chris

  • Christopher Hossack said:

    My test (context.zip) program uses the following version of compiler, RTOS, XDC

    (Please visit the site to view this file)

    • Compiler version TI v5.2.2
    • TI-RTOS for TivaC 2.14.4.31
    • XDCtools version: 3.31.1.33_core

    I ported your example to run on a MSP-EXP432P401R using the following tools:

    • Compiler TI v5.2.7
    • TI-RTOS for MSPx 2.16.0.08
    • XDCtools version 3.31.1.33_core

    The reason for porting to another Cortex-M4F device is that the MSP-EXP432P401R has a XDS110 which supports SWO trace. The intention was to be able to re-create the problem, and then use SWO trace to investigate.

    However, in this MSP432 example I haven't been able to get the GetAdcIvalue() function to report an invalid value. By using the debugger confirm the following are happening as in your TM4C129 example:

    • heartBeatFxn is running as a task context, and can see it toggling a LED.
    • SwiClockFunc is being called as a SWI, as verified by setting a breakpoint in the function and from the call stack confirmed that called from a TI-RTOS SWI handler. Also, can see GetAdcIvalue() incrementing a global variable "good_count" to see that a valid value was calculated. The global variable "bad_count" remains at zero, meaning no invalid value has been seen.
    • HwiPwmFunc is being called as a HWI from a timer interrupt, as verified by setting a breakpoint in the function and from the call stack confirm that called directly from a hardware interrupt.

    The MSP432 TI-RTOS .cfg file is an exact copy of the TM4C example. The source files have changed to use MSP432 peripherals instead of TM4C129 peripherals.

    The MSP432 example is attached pwmled_MSP_EXP432P401R_TI_MSP432P401R.zip

    Not really sure what this MSP432 shows, either I haven't recreated the exact Cortex-M4F TI-RTOS conditions which cause to the TM4C129 failure or something else.

  • Hi Chester,
    I spent many hours trying to cut my original program down to the current test example without fixing it ;-)
    But I will buy a MSP-EXP432P401R tomorrow and see if I can reproduce the error.
    I haven't used the SWO trace before, but do you think I will be able to see the last 5us/(1/120MHz) eg 600 instructions, that were executed before it hits my break-point? Hopefully this will let me see exactly when the 1ms HWI and my 5us HWI interrupts occurred. Of course the MSP-EXP432P401R only runs at 48MHz, so hopefully it will be less instructions I need to capture.
    Using a different approach I was thinking of using my EK-TM4C1294XL, disabling the on-board JTAG and then wire up a 20 pin Cortex Debug+ETM. Which JTAG debugger would you then use to capture a trace of the instructions?
    cheers
    Chris
  • Hi,
    I've ordered a MSP-EXP432P401R and should get it tomorrow. I've also posted a question on the TI-RTOS forum to see if they have any other ideas.
    e2e.ti.com/.../506837
    cheers
    Chris
  • Christopher Hossack said:
    I haven't used the SWO trace before, but do you think I will be able to see the last 5us/(1/120MHz) eg 600 instructions, that were executed before it hits my break-point?

    The SWO trace can only sample the PC at a minimum of 64 cycles - see section 4.8.5.1 Trace DWT Event Type Configuration of www.ti.com/lit/pdf/slaa674 (that is a MSP432™ Debugging Tools document but should also apply to SWO trace in a TM4C129 device). Therefore, SWO trace won't be able to capture the exact sequence of instructions leading up to a breakpoint.

    Christopher Hossack said:
    Hopefully this will let me see exactly when the 1ms HWI and my 5us HWI interrupts occurred.

    One other option for SWO trace is Interrupt Profiling which logs entrance into and exit out of an interrupt, which should allow you to see if one interrupt pre-empts another.

    Christopher Hossack said:
    Using a different approach I was thinking of using my EK-TM4C1294XL, disabling the on-board JTAG and then wire up a 20 pin Cortex Debug+ETM. Which JTAG debugger would you then use to capture a trace of the instructions?

    I don't have any experience of using ETM trace. CCS supports the XDS560v2 PRO TRACE Receiver & Debug Probe which has ETM support. However, the XDS560v2 PRO TRACE product page doesn't list ETM support for TM4C129 devices (ETM support is listed for Cortex-A and Cortex-R based devices). Suggest you ask about TM4C129 ETM support on the CCS forum.

  • A few thoughts -

    1. If your interrupt handler is standard C, you will not have any issues with context switches. The hardware knows what to do. The Cortex-M doesn't need special handling for interrupt code, and doing so may cause interesting behavior. Installing the function into the interrupt table is an exercise for the reader.

    This will all get very interesting at the point where the ISR passes data to from TI/RTOS. You need to ensure that any data that passes between the interrupt handler and the rest of the system is passed atomically. Is it possible that your handler is pre-empting TI/RTOS and corrupting data?

    2. You should dump out the priority table from the NVIC and confirm that your Buck function is actually running at a higher priority than the rest of the system. Beware - the NVIC numbers priorities backwards from what you might expect.

    3. Check your stacks for overflow.

    4. The code sample above refers to Cortex-M requirements, if I recall correctly. Manipulating BASEPRI requires barriers/stalls/etc.
  • Hi,

    1. If your interrupt handler is standard C, you will not have any issues with context switches. The hardware knows what to do. The Cortex-M doesn't need special handling for interrupt code, and doing so may cause interesting behavior. Installing the function into the interrupt table is an exercise for the reader.

    I use the Sys/Bios Hwi_create() function as shown below

    Hwi_Params_init(&hwiParams);
    hwiParams.priority = 0;
    hwiParams.enableInt = true;
    Hwi_create(INT_PWM0_0, (Hwi_FuncPtr)HwiPwmFunc, &hwiParams, NULL);
    This will all get very interesting at the point where the ISR passes data to from TI/RTOS. You need to ensure that any data that passes between the interrupt handler and the rest of the system is passed atomically. Is it possible that your handler is pre-empting TI/RTOS and corrupting data? 

    I think my 5us HWI is interrupting the Sys/Bios 1ms system tick, but the Sys/Bios ti_sysbios_family_arm_m3_Hwi_dispatch__I is doing something where it doesn't expect to be interrupt and is ending up corrupting the SWI context.

    2. You should dump out the priority table from the NVIC and confirm that your Buck function is actually running at a higher priority than the rest of the system. Beware - the NVIC numbers priorities backwards from what you might expect.

    I looked at the NVIC and it looks like my HWI is the highest priority. Here's a screen shot from CCS

    3. Check your stacks for overflow. 

    There are no stack overflows when it hits my break point. The original code called an assert which did cause an overflow, but this is after the corruption. I changed the assert to increment a global variable instead and there were no more stack over flows but still the corruption.

    4. The code sample above refers to Cortex-M requirements, if I recall correctly. Manipulating BASEPRI requires barriers/stalls/etc.

    So what would happen if a higher priority interrupts occurs when manipulating the BASEPRI register?

    thank for your help

    cheers

    Chris

  • hi,
    thank you. I will get my MSP432 board today and play with it. I was thinking of buying a j-link pro with trace and using segger's debugger to connect to my target (eg by-passing CCS) and try and capture the trace. But its a lot of money if it doesn't work ;-( I will contact them and ask if it will work before I splash the cash.
    I'll let you know how I get on.
    cheers
    Chris
  • Hi Chester,

    I've got my msp432 dev board and rewrote my test program (based largely on you code, that saved me hours, thank you). I now fails as before. Here's the new zip file

    context_msp432.zip

    I can see the CPU execution graph as before which works fine. But I then tried to enable interrupt profiling and/or core trace (via the tools menu), but my trace windows always contained no data. Is there some other option I need to set to get trace data appearing?  Does it work on your board with your project?

    cheers

    Chris

  • That looks like the RTOS is locking out interrupts. The RTOS system tick should not care about being pre-empted by a higher priority, non-RTOS exception. The Cortex-M was designed to work that way.

    You really need a full picture of what's happening on your system - what interrupts are enabled, what priority they are running at, when they get disabled. BASEPRI is the architectural feature that was designed to support your application - disabling most, but not all IRQs.
  • hi R,
    When you say "That looks like the RTOS is locking out interrupts.", which bit of my answer are you referring to?
    I know the RTOS isn't locking out my interrupt since I can see my HWI gpio pin toggling correctly (I use persist to capture any missed or delay HWIs). Are you referring to the RTOS interrupts all being set to 244?

    "You really need a full picture of what's happening on your system" - I agree, but a lot of it is hidden in the multiple layers of Sys/Bios code. I can only easily see what CCS shows me. Also most of the time it works, so trying to track down a timing fault without a ETM is a bit tricky ;-)

    cheers
    Chris
  • Looking at your code, I can't really tell whats happening when you add the handler via the TI/RTOS calls. You specify a priority, but I don't have the code handy to figure out how that gets installed. You should be able to figure out whats really happening by looking at the NVIC priority registers on a running system, and disassembling your handler. If its going through some sort of trampoline provided by TI/RTOS you'll get in trouble because you could easily violate pre-emption rules. RTOS's often do this. You can check that by comparing the address of your routine with what gets installed in the Exception vector table. Ideally this special handler would be running at a higher exception priority than the rest of the rtos and only interact with the rest of the system by reading a single 32-bit value.
  • Christopher Hossack said:
    . But I then tried to enable interrupt profiling and/or core trace (via the tools menu), but my trace windows always contained no data. Is there some other option I need to set to get trace data appearing?

    For SWO trace to work, in the Target Configuration the "JTAG / SWD / cJTAG Mode" for the XDS110 must be set to "SWD mode - Aux COM port is target TDO pin":

    Christopher Hossack said:
    Does it work on your board with your project?
    I imported your project, and after changing the "JTAG / SWD / cJTAG Mode" to "SWD mode - Aux COM port is target TDO pin" was able to get Interrupt Profiling data. The following shows the end of the Raw Trace viewer at the point a breakpoint was hit in the GetAdcIvalue() function on detecting an invalid value:

    There are numerous reports of OVERFLOW in the Trace Status, which I think means the interrupt rate is causing some SWO trace samples to be lost. Haven't yet got any more conclusions on the root cause of the problem.

  • hi Chester,
    I'll try that tomorrow. I tried with IAR and j-link on my TM4C1294 board and got the same results as you, a lot of OVERFLOWs.
    I've just started trying to slow down the CPU clock from 120MHz to 1.2MHz (it seems to stop working below this). I was hoping that running the cpu at slower speeds would allow me to extract more data. So far it's not working, but I'll try again on the msp432 board tomorrow.
    cheers
    Chris
  • Christopher Hossack said:
    I've just started trying to slow down the CPU clock from 120MHz to 1.2MHz (it seems to stop working below this). I was hoping that running the cpu at slower speeds would allow me to extract more data. So far it's not working, but I'll try again on the msp432 board tomorrow.

    I think the baud rate for the SWO trace output is derived from the CPU clock, optionally divided with a pre-scaler. In which case simply slowing down the CPU clock won't allow more data to be extracted.

    If the interrupt rate could be slowed down, and the failure symptoms remain the same, that should allow more data to be collected. 

  • hi Chester,

    I couldn't but help myself and started to play. If you reduce the PWM freq from 5us to 50us (uint16_t   pwmPeriod = 50;) it works ;-)

    Now I just need to find out what's happening.

    cheers

    Chris

  • Chris, what are you doing in your interrupt? How is it communicating with the rest of the system?

    Robert
  • hi Robert,
    In my test code it just does some integer multiplication and addition (read from global values) and stores the result in a global variable. In my final code it reads ADC values and writes the output to a PWM module to adjust the duty. But for tracking down this corruption I've stripped all of that out since it's not important.
    cheers
    Chris
  • It stilldoes the integer work? Can you show the interrupt routine? Sounds like it should be short.

    Robert
  • Hi,

    If you look at the various posts you will find the download links to two projects that contain the whole code. But here's the HWI code you want

    #define _xsmmlar(a,c,acc) (((int32_t)(((int64_t)(a)*(c))>>32))+(acc))
    
    inline void CNTRL_3p3zFixedUnified(CNTRL_DataFixedUnified* pCtrl)
    {
    	int32_t acc =0;
    
    	acc = _xsmmlar(pCtrl->m_B3, pCtrl->m_E[2], acc); pCtrl->m_E[2] = pCtrl->m_E[1];
    	acc = _xsmmlar(pCtrl->m_B2, pCtrl->m_E[1],acc); pCtrl->m_E[1] = pCtrl->m_E[0];
    	acc = _xsmmlar(pCtrl->m_B1, pCtrl->m_E[0],acc); pCtrl->m_E[0] = pCtrl->m_Kerr*((pCtrl->m_Ref - pCtrl->m_FeedBack));
    	acc = _xsmmlar(pCtrl->m_B0, pCtrl->m_E[0],acc);
    
    	acc = _xsmmlar(pCtrl->m_A3, pCtrl->m_U[2],acc); pCtrl->m_U[2] = pCtrl->m_U[1];
    	acc = _xsmmlar(pCtrl->m_A2, pCtrl->m_U[1],acc); pCtrl->m_U[1] = pCtrl->m_U[0];
    	acc = _xsmmlar(pCtrl->m_A1, pCtrl->m_U[0],acc);
    
    	pCtrl->m_Out = (uint32_t)acc;
    }
    
    __interrupt void HwiPwmFunc( void )
    {
        Buck.m_Ref = m_AdcVlimit;
        Buck.m_FeedBack = m_AdcVout;
        CNTRL_3p3zFixedUnified(&Buck);
        MAP_Timer_A_clearInterruptFlag(TIMER_A1_BASE);
    }

    I originally was using the intrinsic function _smmlar, but replaced it with a C-macro to eliminate this as a cause of my problem.

    cheers

    Chris

  • Christopher Hossack said:
    If you look at the various posts you will find the download links to two projects that contain the whole code.

    I generally don't download. At best that would be frowned upon.

    I'll digest this some but what immediately strikes me is the presence of 64 bit arithmetic.

    Robert

  • hi,

    so after a quick look I can state the following.

    When corruption occurs the set of events do not look very different from a normal cycle.

    The corruption only happens after the PENDSV interrupt

    WORKS

    18.89us 19.99us Entry to Exception  TA1_N   0x1B
     1.06us         Exit from Exception TA1_N   0x1B
     0.06us         Return to Exception         0x0
    18.86us 20us    Entry to Exception  TA1_N   0x1B
     1.06us         Exit from Exception TA1_N   0x1B
     0.06us         Return to Exception         0x0
    18.83us 19.96us Entry to Exception  TA1_N   0x1B
     1.06us         Exit from Exception TA1_N   0x1B
     0.03us         Return to Exception         0x0
    18.7us          Entry to Exception  TA0_0   0x18
     0.16us 19.96us Entry to Exception  TA1_N   0x1B
     1.06us         Exit from Exception TA1_N   0x1B
     0.03us         Return to Exception TA0_0   0x18
    13.26us         Exit from Exception TA0_0   0x18
     0.03us         Return to Exception         0x0
     1.2us          Entry to Exception  PENDSV  0xE
     0.26us         Exit from Exception PENDSV  0xE
     0.06us         Return to Exception         0x0

    corruption

    18.86us 19.96us Entry to Exception  TA1_N   0x1B
     1.06us         Exit from Exception TA1_N   0x1B
     0.03us         Return to Exception         0x0
    18.9us  20us    Entry to Exception  TA1_N   0x1B
     1.06us         Exit from Exception TA1_N   0x1B
     0.06us         Return to Exception         0x0
    18.86us 19.99us Entry to Exception  TA1_N   0x1B
     1.06us         Exit from Exception TA1_N   0x1B
     0.06us         Return to Exception         0x0
    18.49us         Entry to Exception  TA0_0   0x18
     0.33us 19.96us Entry to Exception  TA1_N   0x1B
     1.06us         Exit from Exception TA1_N   0x1B
     0.03us         Return to Exception TA0_0   0x18
    13.06us         Exit from Exception TA0_0   0x18
     0.03us         Return to Exception         0x0
     1.19us         Entry to Exception  PENDSV  0xE
     0.26us         Exit from Exception PENDSV  0xE
     0.06us         Return to Exception         0x0
    corruption occurs in SWI function

    I then looked at other cycles when PENDSV occurred and it looks like corruption happens when the 1ms Sys/Bios timer (TA0_0 0x18) is interrupted by my HWI (TA1_N 0x1B) between 0.26us and before 0.33us

    8.69us      Entry to Exception   TA0_0   0x18
    10.1us      Entry to Exception   TA1_N   0x1B
    pass
    18.7us      Entry to Exception   TA0_0   0x18
    0.16us      Entry to Exception   TA1_N   0x1B
    pass
    8.63us      Entry to Exception   TA0_0   0x18
    10.19us     Entry to Exception   TA1_N   0x1B
    pass
    18.49us     Entry to Exception   TA0_0   0x18
    0.33us      Entry to Exception   TA1_N   0x1B
    fail
    9.26us      Entry to Exception   TA0_0   0x18
    9.59us      Entry to Exception   TA1_N   0x1B
    pass
    9.13us      Entry to Exception   TA0_0   0x18
    9.76us      Entry to Exception   TA1_N   0x1B
    pass
    8.96us      Entry to Exception   TA0_0   0x18
    9.93us      Entry to Exception   TA1_N   0x1B
    pass
    8.76us      Entry to Exception   TA0_0   0x18
    10.13us     Entry to Exception   TA1_N   0x1B
    pass
    18.63us     Entry to Exception   TA0_0   0x18
    0.26us      Entry to Exception   TA1_N   0x1B
    fail

    I also looked at the vector table to double check the interrupts values

    Event Value Vector offset Vector value Priority register
    TA1_N 0x1B(27) 0x6c 0x37b1(HwiPwmFunc) pri_11=0
    TA0_0 0x18(24) 0x60  0x3075(ti_sysbios_family_arm_m3_Hwi_dispatch__I) pri_8=7
    PENDSV 0x0e(14) 0x38 0x6eb1(ti_sysbios_family_arm_m3_Hwi_pendSV__I)

    So the MSP432 runs at 48MHz (20ns), so around 15 instructions inside ti_sysbios_family_arm_m3_Hwi_dispatch__I I should find some code that does something strange. I'm not sure if 15 is correct and if anybody would like to suggest a better guess then please let me know.

    cheers

    Chris

  • hi Robert,
    I would have thought 64bit arithmetic context (which just uses 2x32bit registers..I think) would be handled just like 32bit contexts. Do you think I need to push some other register from within my HWI?
    cheers
    Chris
  • It struck me Chris since moving to 64 bits invokes library/compiler support for extended precision operation. There are multiple ways of doing this and some are completely transparent. Some, though, maintain state information outside of the register context and are thus vulnerable. This is entirely compiler dependent. The compiler documentation should mention if extra state information needs to be preserved when working with extended datatypes.

    I have worked in the past with architectures/compilers that needed extra state preservation for extended precision, or division or most commonly floating point. And, of course, generally the stdio functions have a lot of hidden state.

    I'm not saying that it's the case, if fact I think you are probably right, but it is something that is a possibility.

    Robert
  • hi,

    so after a really fresh cup of coffee I looked at the code in ti_sysbios_family_arm_m3_Hwi_dispatch__I, so see whats going on. I haven't programmed in ARM asm for a very long time, so I'm just guessing about this bit.

            tst     lr, #4          ; context on PSP?
            ite     NE
            mrsne   r1, psp         ; if yes, then use PSP
            moveq   r1, sp          ; else use MSP
            ldr     r0, [r1, #24]   ; get IRP (2nd of 8 items to be pushed)
    
        .if __TI_VFP_SUPPORT__
            vstmdb  {d0-d7}, r1!    ; push vfp scratch regs on appropriate stack
            vmrs    r2, fpscr       ; push fpscr too
            str     r2, [r1, #-8]!  ; (keep even align)
    
            tst     lr, #4          ; context on PSP?
            ite     NE
            msrne   psp, r1         ; update appropriate SP
            moveq   sp, r1
        .endif

    It looks to me that this code is doing the following

    • it works out which stack to use PSP or MSP and copies that value in to R1.
    • It then pushes the vfp scratch registers on to R1, which updates R1
    • It then updates either PSP or MSP with R1

    I think the problem is that after pushing the vfp scratch registers to R1 (eg either PSP or MSP stack) my HWI kicks in. This then pushes its context to the MSP overwriting the vfp scratch registers.

    So this code should really adjust the stack value first and then write the vfp scratch registers.

    What do you all think?

    cheers

    Chris

  • Mine is probably rustier than yours but I think you're right.

    Can you put that in a critical section (i.e. disable interrupts)? Arguably it should be in any case even if you update the stack first. That would at least prevent the issue and then you could consider in detail if it actually did need to be in a critical section or just re-written a bit.

    Robert
  • hi Robert
    I'll give that a go tomorrow, I'm too busy celebrating at the moment ;-)
    I also need to work out how to rebuild the Sys/Bios with my changes, and I don't suppose you know how to disable/enable all interrupts in asm?
    cheers
    Chris
  • Take at look at CPUcpsie and CPUcpsid in cpu.c of the TIVAWare library.

    Robert
  • You are right,   This is a major hazard.    Assuming that the code in question is actually running (are you really using the __TI_VFP_SUPPORT option?) an interrupt that pre-empts in between the register pushes and the update of the stack pointer is going to over-write the just-pushed registers.  

    The .if block needs to be wrapped in a cpsid i/cpsie i pair.  

    This is a TI/RTOS bug...


  • Robert Adsett said:
    It struck me Chris since moving to 64 bits invokes library/compiler support for extended precision operation.

    \Looking at the assembler listing shows the compiler has used the Cortex -M4 SMULL instruction, which multiplies two signed 32-bit operands and produces a signed 64-bit result. There are no calls to library/compiler support functions.

  • hi,

    TI has contacted me on another post I raised and confirmed this is a bug.

    "We have been able to reproduce the problem & have filed the SYSBIOS-208 bug to fix this in a future release."

    It's nice to know I wasn't going crazy. I'm going to award  with the points for this question, because without his help in getting the ETM working with interrupt profiling I wouldn't of been able to track down the fault. And he went the extra mile and porting my test code to the MSP432 and included idiot proof screen shots of what I needed to do. But I would also like to thank everybody else who helped me.

    cheers

    Chris

    PS Chester, can you add one more post copying TI's statement, so when I mark it as answered your post will appear next to the question.

1 2