This thread has been locked.

If you have a related question, please click the "Ask a related question" button in the top right corner. The newly created question will be automatically linked to this question.

MSP430FR5043: Using this solution for gas metering, the problem of determining the excitation frequency by sweeping the frequency in the GUI

Part Number: MSP430FR5043

Hi Team,

There's an issue from the customer need your help:

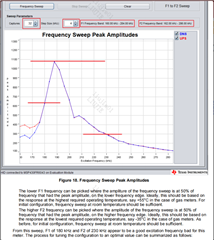
In the document linked below, it is stated that the frequency sweep is determined by 50% of the peak amplitude to determine the F1 and F2 frequencies. It can be seen from the image that the peak amplitude is about 1100, so why the final selected F1 and F2 frequency point peaks are More than 600, the other is 300. Not 50% as described.

www.ti.com.cn/.../slau824.pdf

Thanks & Regards,

Ben

  • Hi,

    In the figure 18, it is a method to roughly determine the F1 and F2 selected range. You also need to adjust the F1 F2 frequency for the final configuration. Based on the description in the document. 

    "Please note that after the initial evaluation is complete, for further system optimization and production, there should be at least two sweeps conducted: one at -35°C and one at 55°C. F1 should then be set around the 6dB from peak at 55°C. The frequency response is expected to shift to the left (lower frequency) at 55C. At -35°C, the frequency response is expected to shift to the right (higher frequency). F2 should be set to ~15kHz greater than the 6dB point for this sweep. The additional 15kHz of excitation is used to reduce the ring down of the transducer. If the transducer still has significant ring down excitation, F2 should be increased further. Also, the choice of -35°C and 55°C depends on the gas meter requirements."

    Best regards,

    Cash Hao 

**Attention** This is a public forum