This thread has been locked.

If you have a related question, please click the "Ask a related question" button in the top right corner. The newly created question will be automatically linked to this question.

EVM430-FR6047: Incorrect standard deviation in USS Design Center GUI

Part Number: EVM430-FR6047

I'm using EVM430-FR6047 with USS Design Center and MSP430FR6047EVM_USS_Demo project.

Design Center GUI and demo project versions are 02_40_00_00.

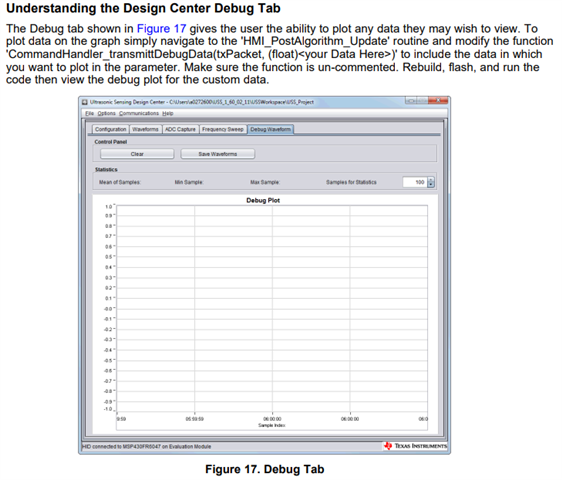
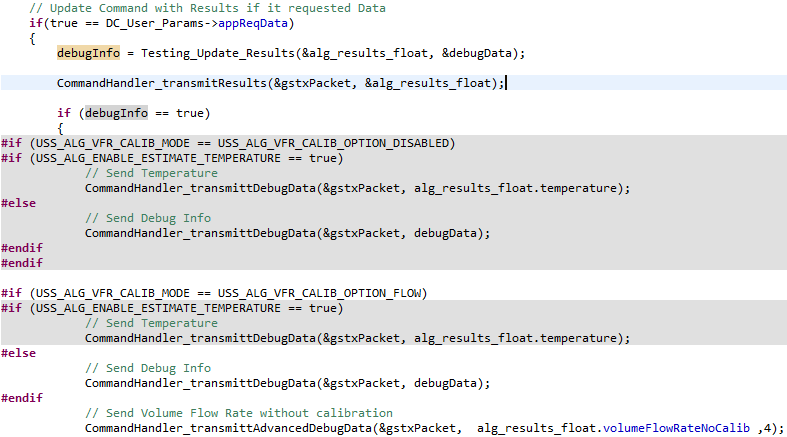
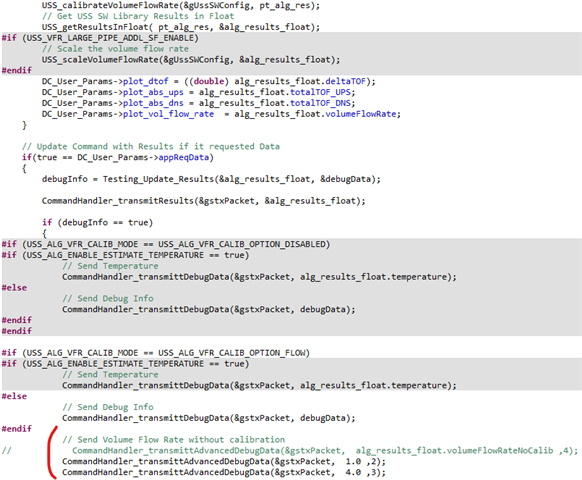
In Design Center User's Guide, we can custom the debug waveform,

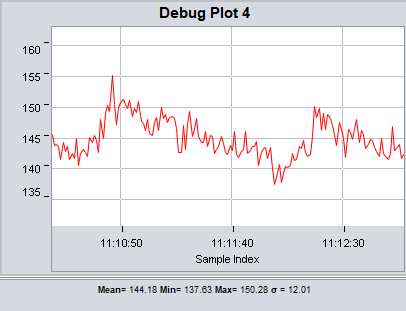
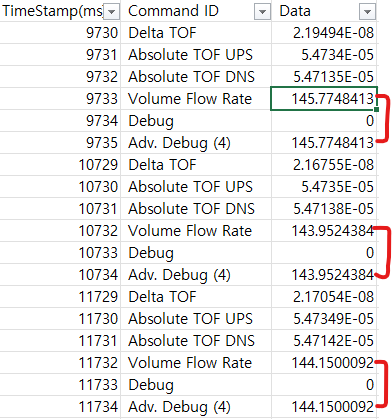
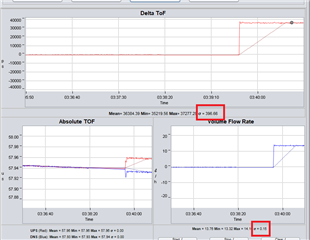
so I check the Debug waveform with hard coded float value. (1.0 in plot 2 and 4.0 in plot 3)

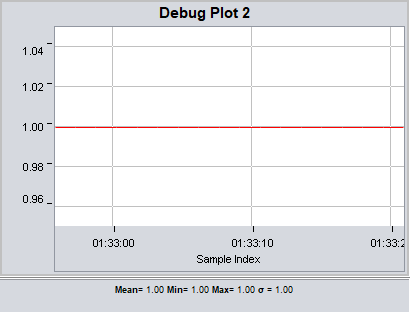
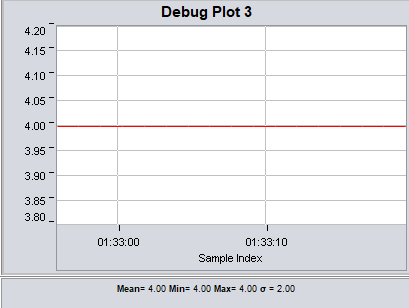
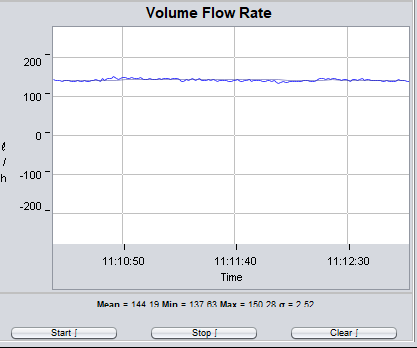
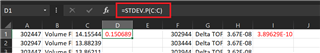
Graph looks good, but standard deviation is not zero even thought all of the values are the same.

It looks like standard deviation is the root of Mean value.

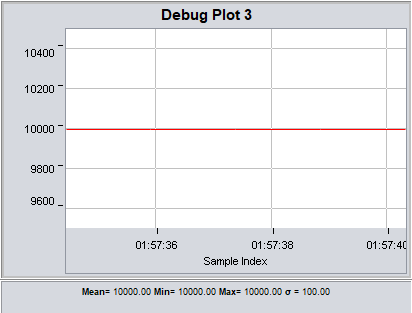
Isn't standard deviation value zero when all of the values are the same?

  • Hi Kim,

    I will forward your thread to USS expert, and he will share his comments on your question. Thanks!

    B.R.

    Sal

  • Hi,

    Could you try with different values instead of using the same constant value? 

    Best regards,

    Cash Hao

  • I check volume flow rate graph in two locations, using pipe and water.

    1. Waveforms --> Volume Flow Rate

    2. Debug Waveform --> Debug Plot 4

    In waveforms.csv,

    I check all of the Volume Flow Rate and Adv. Debug (4) values.

    And they have same values in same time stamp.

    So, these two graphs are the same.

    But standard deviation values are different.

    Volume Flow Rate -> standard deviation = 2.52

    plot 4 -> standard deviation = 12.01

    Thank you for your help.

  • Hi,

    This sounds interesting to me. I need to check how the standard deviation in the debug plot gets calculated. I do not find it in the code right now. I need to spend some time to look into this.

    Best regards,
    Cash Hao

  • Hi,

    I checked the code, the dTOF std in the waveform page is generated by the mathematics_CalcStDevflt function. However, I do not find this function is get called for the debug plot data. So, I do not know how does the STD value of the debug plot coming from. 

    I also checked the STD data is correct or not. I save the waveform data and choose 100 data points for STD calculation. I am using the STDEV.P function in excel. And the results match the result in GUI waveform page. So, the STD results in waveform page should be considered as correct one.

    Best regards,

    Cash Hao

**Attention** This is a public forum