Part Number: MSP432p401r
Tool/software: TI-RTOS
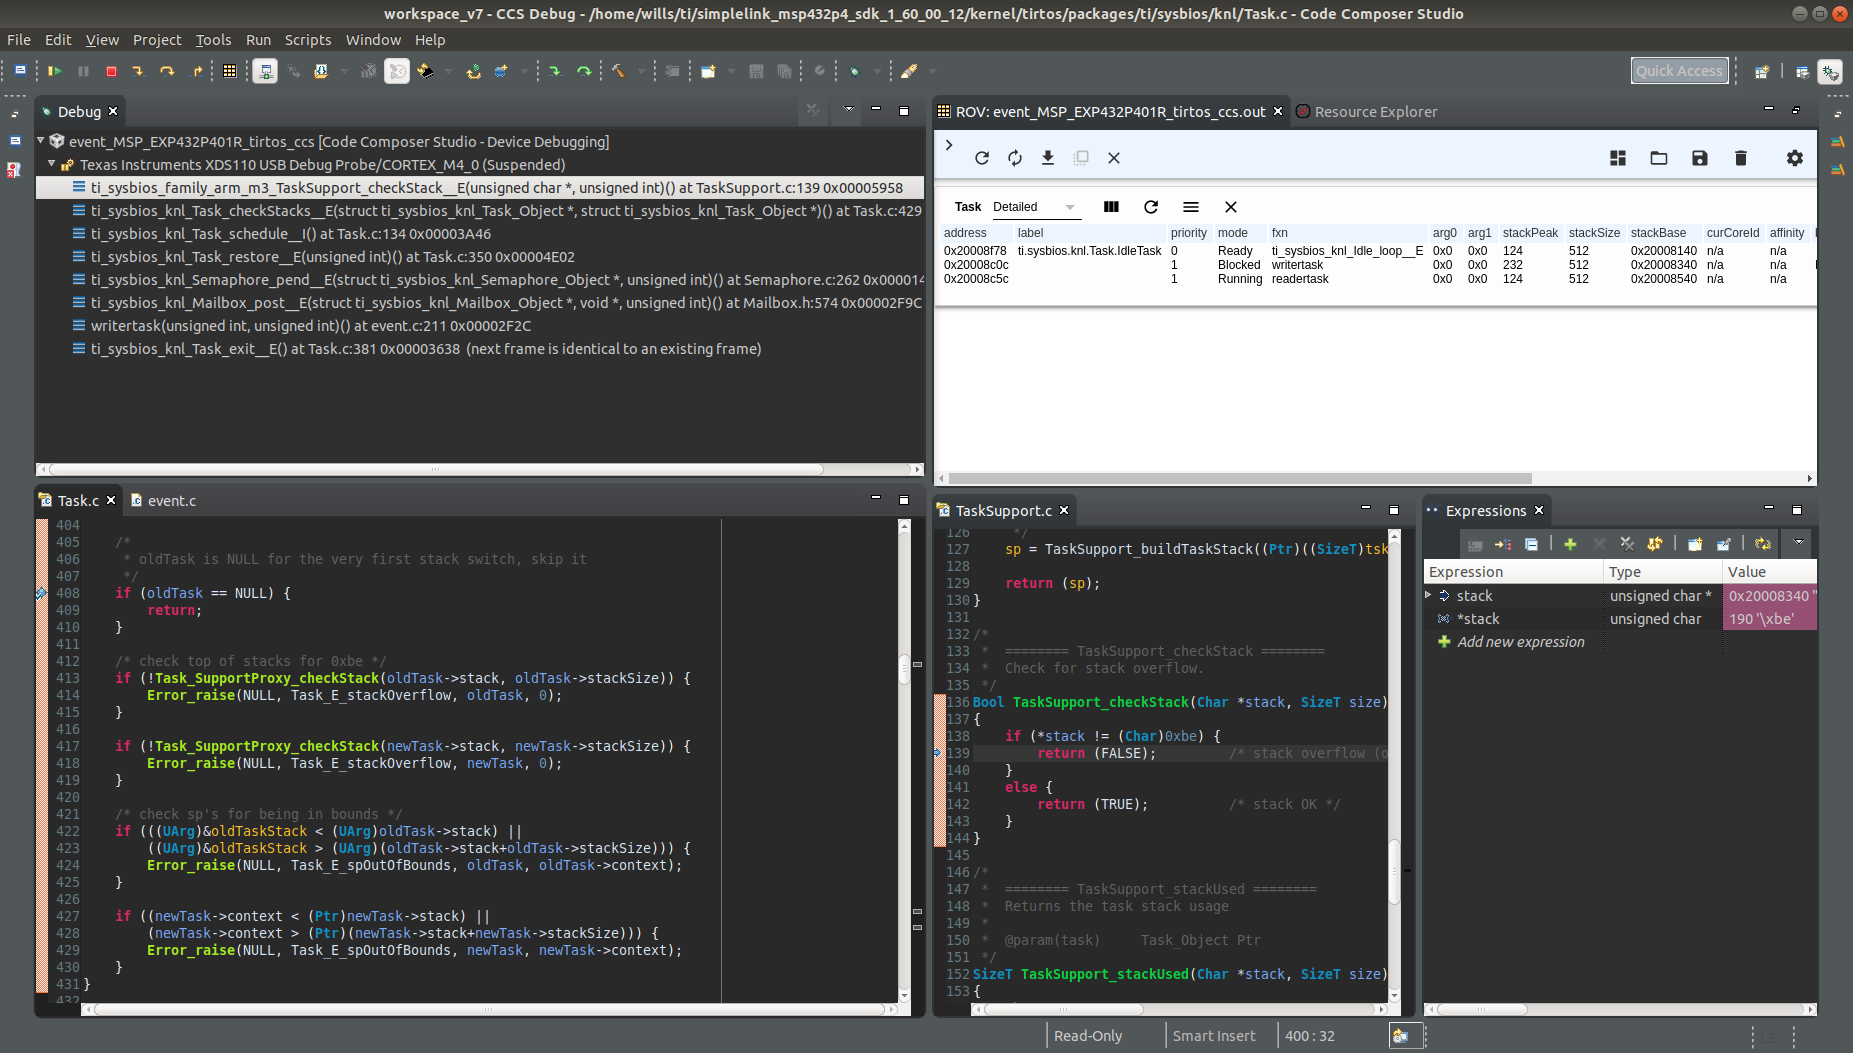
When debugging a project it was noticed that a Task_E_stack_Overflow and Task_E_spOutOfBounds error was raised every time a task switch occurred. Viewing the stacks and stack peaks showed that an overflow had not occurred and that the 0xbe cookie was present. The project appeared to operate correctly otherwise.
To isolate the problem a simple task was created that went to sleep once a counter reached a certain value. Breakpoints were placed in Task_checkStacks() and it was observed that on the switch to the idle task an overflow and out of bounds error was raised. The screen shot below shows where the error was raised as well as the code used, stack trace, ROV view of Tasks and Hwi module.
Device: MSP432P401R
SDK: 1.60.00.12
CCS: 7.4.0.00015
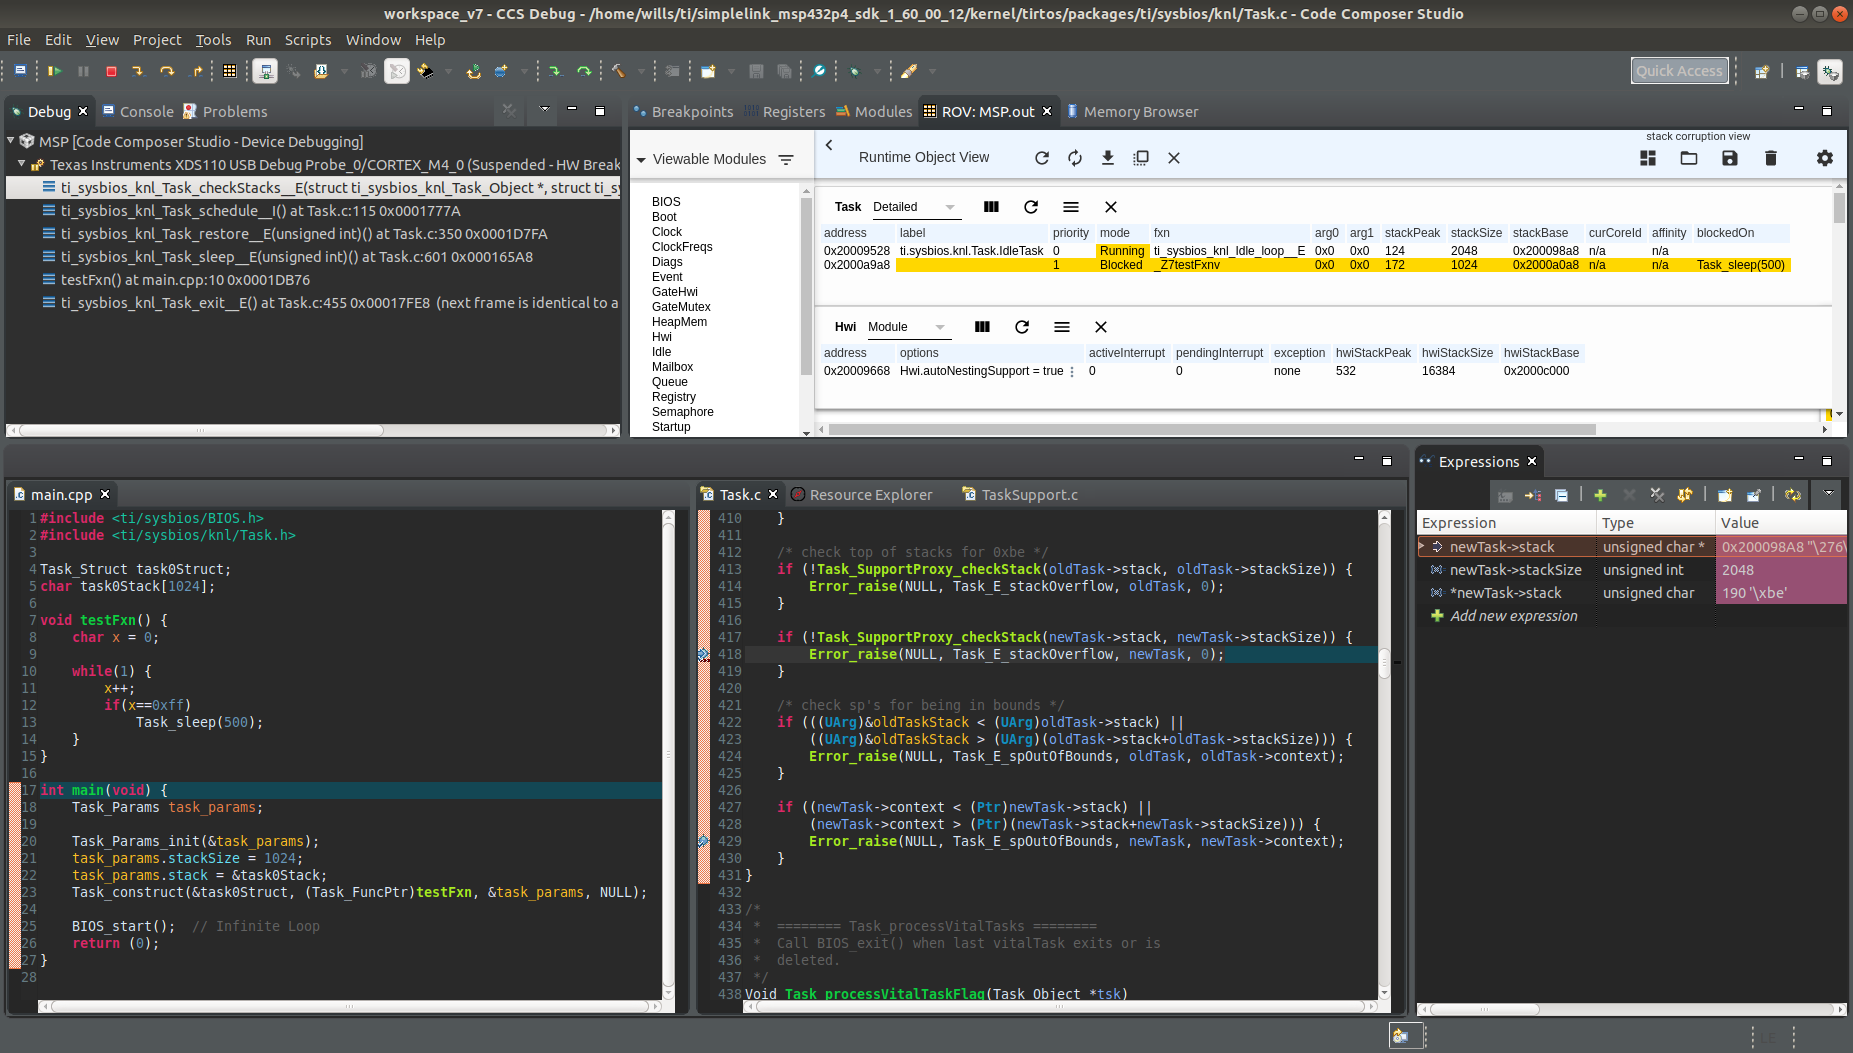
The stack peaks indicate that overflow should not be occurring. TaskSupport_checkStack() returns false when *stack is compared to the cookie which indicates a stack overflow has occurred or it is corrupted. From the memory browser it appears that the stack is being written continuously to. The next screen shot shows what is occurring.
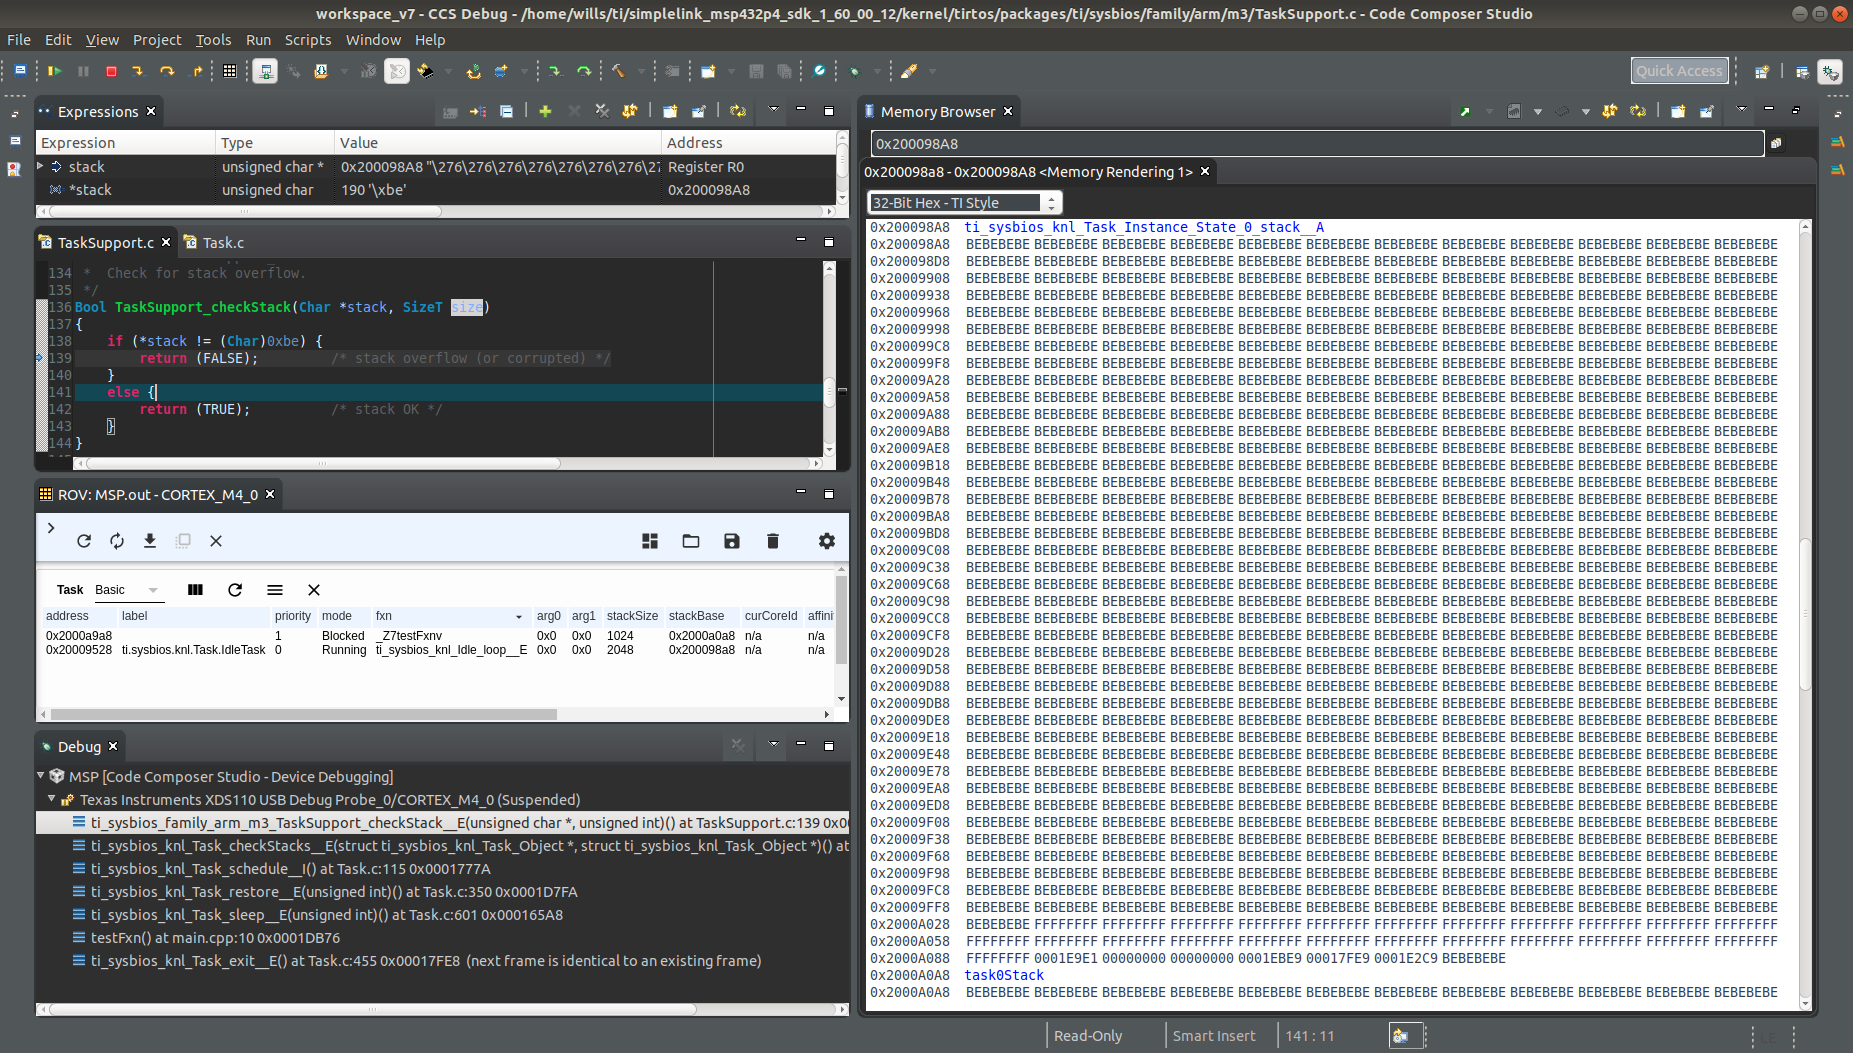
It is a similar situation for every task switch. At this point I imported the 'events' example from Resource Explorer, built the project and placed the breakpoints in Task_checkStacks(). Again, I saw the same errors being raised even though there was no overflow and 0xbe was present.
Why am I getting this error? Has the stack been corrupted somehow or is there corruption occurring elsewhere? How do I stop this error from occurring?
The configuration file for the code used in the screen shots is attached. Thank you in advance.