This thread has been locked.

If you have a related question, please click the "Ask a related question" button in the top right corner. The newly created question will be automatically linked to this question.

TDA4VM: CSITX node,Unable to meet 30 fps

Part Number: TDA4VM

Hi Team,

The customer has below question need your help.

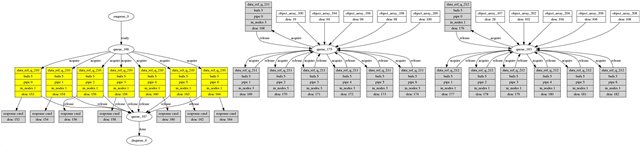
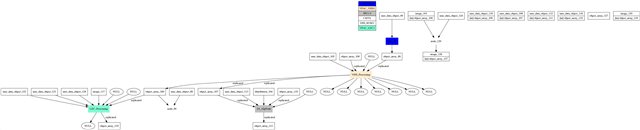
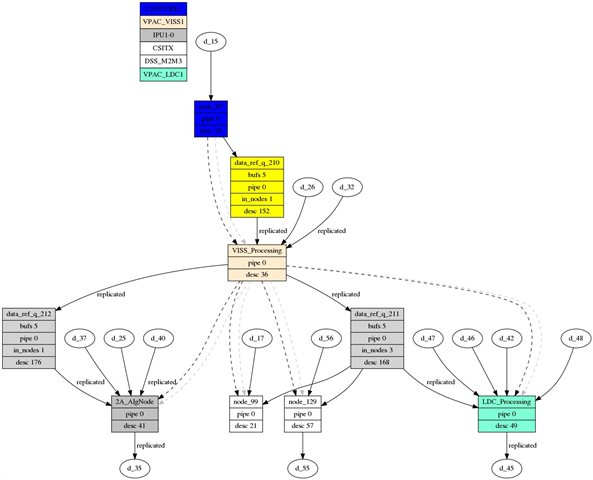
My pipeline is capture(raw_data)->viss->csitx,Resolution:3840*2166,viss out uyvy422,csitx node,avg time over 33.3ms.if my pipeline add ldc node,Common viss data with csitx。The average time of csitx node will reach 36ms.

/* CSITX Start */
#define NUM_CHANNELS        (1U)
#define CSITX_INST_ID       (0U)

#define CSITX_LANE_BAND_SPEED       (TIVX_CSITX_LANE_BAND_SPEED_950_TO_1000_MBPS)
#define CSITX_LANE_SPEED_MBPS       (1000)
    // uint32_t loopCnt;
    vx_user_data_object csitx_config;
    tivx_csitx_params_t local_csitx_config;
    /* CSITX Config initialization */
    tivx_csitx_params_init(&local_csitx_config);
    local_csitx_config.numInst = 1U;
    local_csitx_config.numCh = NUM_CHANNELS;
    local_csitx_config.instId[0U] = CSITX_INST_ID;
    local_csitx_config.instCfg[0U].rxCompEnable = (uint32_t)vx_true_e;
    local_csitx_config.instCfg[0U].rxv1p3MapEnable = (uint32_t)vx_true_e;
    local_csitx_config.instCfg[0U].laneBandSpeed = CSITX_LANE_BAND_SPEED;
    local_csitx_config.instCfg[0U].laneSpeedMbps = CSITX_LANE_SPEED_MBPS;
    local_csitx_config.instCfg[0U].numDataLanes = 4U;
    for (loopCnt = 0U;
         loopCnt < local_csitx_config.instCfg[0U].numDataLanes;
         loopCnt++)
    {
        local_csitx_config.instCfg[0U].lanePolarityCtrl[loopCnt] = 0u;
    }
    for (loopCnt = 0U; loopCnt < NUM_CHANNELS; loopCnt++)
    {
        local_csitx_config.chVcNum[loopCnt] = loopCnt;
        local_csitx_config.chInstMap[loopCnt] = CSITX_INST_ID;
    }

    csitx_config = vxCreateUserDataObject(obj->context, "tivx_csitx_params_t", sizeof(tivx_csitx_params_t), &local_csitx_config);

    if (vx_false_e == yuv_cam_input)
    {

        vx_image tx_frame = vxCreateImage(
                                obj->context, 
                                sensorParams.sensorInfo.raw_params.width, 
                                sensorParams.sensorInfo.raw_params.height, 
                                //VX_DF_IMAGE_YUYV
                                VX_DF_IMAGE_UYVY
                         );
        obj->csitx_frames = vxCreateObjectArray(obj->context, (vx_reference)tx_frame, num_capture_frames);
        status = vxReleaseImage(&tx_frame);
        status = vxGetStatus((vx_reference)obj->csitx_frames);
        if (status != VX_SUCCESS)
        {
            APP_PRINTF("csitx vxCreateObjectArray error\n");
        }
        else
        {
            APP_PRINTF("csitx vxCreateObjectArray success\n");
        }
        obj->csitx_node = tivxCsitxNode(obj->graph, csitx_config, obj->csitx_frames);
    }
    else
    {
        obj->csitx_node = tivxCsitxNode(obj->graph, csitx_config, obj->cap_frames[0]);
    }
    if(status == VX_SUCCESS)
    {
        status = vxReleaseUserDataObject(&csitx_config);
    }
    if (status == VX_SUCCESS)
    {
        status = vxSetNodeTarget(obj->csitx_node, VX_TARGET_STRING, TIVX_TARGET_CSITX);
    }
    else
    {
        APP_PRINTF("capture node set error\n");
    }
    if (status == VX_SUCCESS)
    {
        APP_PRINTF("csitx node set success\n");
    }
    else
    {
        APP_PRINTF("csitx node set error\n");
    }

app_single_came_capture_csitx.html

Thanks,

Annie

  • Hi Annie,

    Can you please share the complete performance log? It might be that LDC is taking more time, but lets first analyze the log.

    Regards,

    Brijesh

  • Hi Brijesh,

    Would you need to provide the generated vcd file? Since the customer could not upload this file to the forum, he changes the suffix to html. Please remove the .html after downloading.

    app_single_came_capture_csitx - 副本.vcd.html

    Thanks.

    Annie

  • Hi Brijesh,

    This is Log.

    APP: Init ... !!!
    MEM: Init ... !!!
    MEM: Initialized DMA HEAP (fd=4) !!!
    MEM: Init ... Done !!!
    IPC: Init ... !!!
    IPC: Init ... Done !!!
    REMOTE_SERVICE: Init ... !!!
    REMOTE_SERVICE: Init ... Done !!!
       804.578661 s: GTC Frequency = 200 MHz
    APP: Init ... Done !!!
       804.586876 s:  VX_ZONE_INIT:Enabled
       804.586895 s:  VX_ZONE_ERROR:Enabled
       804.586910 s:  VX_ZONE_WARNING:Enabled
       804.587729 s:  VX_ZONE_INIT:[tivxInitLocal:130] Initialization Done !!!
       804.587955 s:  VX_ZONE_INIT:[tivxHostInitLocal:86] Initialization Done for HOST !!!
    
     Single Camera Demo - (c) Texas Instruments 2019
     ========================================================
    
     Usage,
      ./vx_app_single_cam_capture_csitx.out --cfg <config file>
    
    Defaulting to interactive mode
    IttCtrl_registerHandler: command echo registered at location 0
    IttCtrl_registerHandler: command iss_read_2a_params registered at location 1
    IttCtrl_registerHandler: command iss_write_2a_params registered at location 2
    IttCtrl_registerHandler: command iss_raw_save registered at location 3
    IttCtrl_registerHandler: command iss_yuv_save registered at location 4
    IttCtrl_registerHandler: command iss_read_sensor_reg registered at location 5
    IttCtrl_registerHandler: command iss_write_sensor_reg registered at location 6
    IttCtrl_registerHandler: command dev_ctrl registered at location 7
    IttCtrl_registerHandler: command iss_send_dcc_file registered at location 8
     NETWORK: Opened at IP Addr = 192.168.11.223, socket port=5000!!!
    tivxImagingLoadKernels done
       804.591093 s: ISS: Enumerating sensors ... !!!
       804.591576 s: ISS: Enumerating sensors ... found 0 : OX08B40_RAW_MAX96717
       804.591592 s: ISS: Enumerating sensors ... found 1 : IMX390_MAX9296
       804.591613 s: ISS: Enumerating sensors ... found 2 : IMX390_MAX9296_LOOPBACK
       804.591641 s: ISS: Enumerating sensors ... found 3 : SENSOR_OX08BC_8M
    4 sensor(s) found
    Supported sensor list:
    a : OX08B40_RAW_MAX96717
    b : IMX390_MAX9296
    c : IMX390_MAX9296_LOOPBACK
    d : SENSOR_OX08BC_8M
    Select a sensor
    [MCU2_0]    804.591330 s: ImageSensor_RemoteServiceHandler: IM_SENSOR_CMD_CREATE
    a
    
    LDC Selection Yes(1)/No(0)
    LDC Selection Yes(1)/No(0)
    1
    Sensor selected : OX08B40_RAW_MAX96717
    app_init done
    Querying OX08B40_RAW_MAX96717
       805.778480 s: ISS: Querying sensor [OX08B40_RAW_MAX96717] ... !!!
       805.779026 s: ISS: Querying sensor [OX08B40_RAW_MAX96717] ... Done !!!
    WDR mode is supported
    CMS Usecase is supported
    obj->aewb_cfg.ae_mode = 0
    obj->aewb_cfg.awb_mode = 0
    Sensor DCC is enabled
    Sensor width = 3840
    Sensor height = 2166
    Sensor DCC ID = 310
    Sensor Supported Features = 0x340
    Sensor Enabled Features = 0x340
       805.779094 s: ISS: Initializing sensor [OX08B40_RAW_MAX96717], doing IM_SENSOR_CMD_PWRON ... !!!
    [MCU2_0]    805.778702 s: ImageSensor_RemoteServiceHandler: IM_SENSOR_CMD_QUERY
    [MCU2_0]    805.778786 s: Received Query for OX08B40_RAW_MAX96717
    [MCU2_0]    805.779287 s: ImageSensor_RemoteServiceHandler: IM_SENSOR_CMD_PWRON
    [MCU2_0]    805.779352 s: IM_SENSOR_CMD_PWRON : channel_mask = 0x1
       805.817503 s: ISS: Initializing sensor [OX08B40_RAW_MAX96717], doing IM_SENSOR_CMD_CONFIG ... !!!
    [MCU2_0]    805.817706 s: ImageSensor_RemoteServiceHandler: IM_SENSOR_CMD_CONFIG
    [MCU2_0]    805.817788 s: Application requested features = 0x340
    [MCU2_0]
    [MCU2_0]    805.817835 s: Configuring cameras OX08B40_RAW_MAX96717
    [MCU2_0]    805.817885 s: Config deserializer...
    [MCU2_0]    806.242847 s: Config deserializer...done!
    [MCU2_0]    806.242926 s: Config serializer...
    [MCU2_0]    806.266657 s: Config deserializer...done!
    [MCU2_0]    806.266732 s: Config sensor...
       807.168585 s: ISS: Initializing sensor [OX08B40_RAW_MAX96717] ... Done !!!
    Creating graph
    Initializing params for capture node
    Initializing params for capture node
    local_capture_config.numDataLanes = 4
    local_capture_config.dataLanesMap[0] = 1
    local_capture_config.dataLanesMap[1] = 2
    local_capture_config.dataLanesMap[2] = 3
    local_capture_config.dataLanesMap[3] = 4
    capture_config laneBandSpeed = 14
    capture_config = 0x0xe7cf10
    Creating capture node
    obj->capture_node = 0x0xe2b810
    csitx vxCreateObjectArray success
    csitx node set success
    [MCU2_0]    807.168282 s: Config sensor...done!
    [MCU2_0]    807.168354 s: IM_SENSOR_CMD_CONFIG returning status = 0
    VISS Set Reference done
    AEWB Set Reference done
    Enabling LDC
    vxSetGraphScheduleConfig done
    Scaler is disabled
    app_create_graph exiting
    app_create_graph done
    
    
     ==========================
     Demo : Single Camera w/ 2A
     ==========================
    
     p: Print performance statistics
    
     s: Save Sensor RAW, VISS Output and H3A output images to File System
    
     e: Export performance statistics
    
     u: Update DCC from File System
    
    
     x: Exit
    
     Enter Choice:
    Unsupported command


     ==========================
     Demo : Single Camera w/ 2A
     ==========================
    
     p: Print performance statistics
    
     s: Save Sensor RAW, VISS Output and H3A output images to File System
    
     e: Export performance statistics
    
     u: Update DCC from File System
    
    
     x: Exit
    
     Enter Choice:    807.241166 s: ISS: Starting sensor [OX08B40_RAW_MAX96717] ... !!!
    [MCU2_0]    807.241498 s: ImageSensor_RemoteServiceHandler: IM_SENSOR_CMD_STREAM_ON
    [MCU2_0]    807.241583 s: IM_SENSOR_CMD_STREAM_ON:  channel_mask = 0x1
    [MCU2_0]    807.241626 s: Configuring cameras OX08B40_RAW_MAX96717
    [MCU2_0]    807.241677 s: Start streaming
       807.625388 s: ISS: Starting sensor [OX08B40_RAW_MAX96717] ... !!!
    [MCU2_0]    807.625917 s:  VX_ZONE_WARNING:[tivxCaptureSetTimeout:774]  CAPTURE: WARNING: Error frame not provided using tivxCaptureRegisterErrorFrame, defaulting to waiting forever !!!
    [MCU2_0]    807.692311 s: p_ae_exp_prg->target_brightness:44
    [MCU2_0]    807.692395 s: 11111
    p
    
    
    Summary of CPU load,
    ====================
    
    CPU: mpu1_0: TOTAL LOAD =   0.48 % ( HWI =   0. 6 %, SWI =   0. 6 % )
    CPU: mcu2_0: TOTAL LOAD =  22. 0 % ( HWI =   0. 0 %, SWI =   0. 0 % )
    CPU: mcu2_1: TOTAL LOAD =   4. 0 % ( HWI =   0. 0 %, SWI =   0. 0 % )
    CPU:  c6x_1: TOTAL LOAD =   0. 0 % ( HWI =   0. 0 %, SWI =   0. 0 % )
    CPU:  c6x_2: TOTAL LOAD =   0. 0 % ( HWI =   0. 0 %, SWI =   0. 0 % )
    CPU:  c7x_1: TOTAL LOAD =   0. 0 % ( HWI =   0. 0 %, SWI =   0. 0 % )
    
    
    HWA performance statistics,
    ===========================
    
    HWA:   VISS: LOAD =   0.57 % ( 3 MP/s )
    HWA:   LDC : LOAD =   0.61 % ( 3 MP/s )
    
    
    DDR performance statistics,
    ===========================
    
    DDR: READ  BW: AVG =    477 MB/s, PEAK =   5011 MB/s
    DDR: WRITE BW: AVG =     35 MB/s, PEAK =   3237 MB/s
    DDR: TOTAL BW: AVG =    512 MB/s, PEAK =   8248 MB/s
    
    
    Detailed CPU performance/memory statistics,
    ===========================================
    
    CPU: mcu2_0: TASK:           IPC_RX:   0. 0 %
    CPU: mcu2_0: TASK:       REMOTE_SRV:   0. 7 %
    CPU: mcu2_0: TASK:        LOAD_TEST:   0. 0 %
    CPU: mcu2_0: TASK:       TIVX_CPU_0:   0.33 %
    CPU: mcu2_0: TASK:          TIVX_NF:   0. 0 %
    CPU: mcu2_0: TASK:        TIVX_LDC1:   0. 1 %
    CPU: mcu2_0: TASK:        TIVX_MSC1:   0. 0 %
    CPU: mcu2_0: TASK:        TIVX_MSC2:   0. 0 %
    CPU: mcu2_0: TASK:       TIVX_VISS1:   0. 5 %
    CPU: mcu2_0: TASK:       TIVX_CAPT1:   0. 1 %
    CPU: mcu2_0: TASK:       TIVX_CAPT2:   0. 0 %
    CPU: mcu2_0: TASK:       TIVX_DISP1:   0. 0 %
    CPU: mcu2_0: TASK:       TIVX_DISP2:   0. 0 %
    CPU: mcu2_0: TASK:       TIVX_CSITX:   0. 2 %
    CPU: mcu2_0: TASK:       TIVX_CAPT3:   0. 0 %
    CPU: mcu2_0: TASK:       TIVX_CAPT4:   0. 0 %
    CPU: mcu2_0: TASK:       TIVX_CAPT5:   0. 0 %
    CPU: mcu2_0: TASK:       TIVX_CAPT6:   0. 0 %
    CPU: mcu2_0: TASK:       TIVX_CAPT7:   0. 0 %
    CPU: mcu2_0: TASK:       TIVX_CAPT8:   0. 0 %
    CPU: mcu2_0: TASK:      TIVX_DISP_M:   0. 0 %
    CPU: mcu2_0: TASK:      TIVX_DISP_M:   0. 0 %
    CPU: mcu2_0: TASK:      TIVX_DISP_M:   0. 2 %
    CPU: mcu2_0: TASK:      TIVX_DISP_M:   0. 0 %
    
    CPU: mcu2_0: HEAP:   DDR_SHARED_MEM: size =   16777216 B, free =   16293120 B ( 97 % unused)
    CPU: mcu2_0: HEAP:           L3_MEM: size =     262144 B, free =     261888 B ( 99 % unused)
    
    CPU: mcu2_1: TASK:           IPC_RX:   0. 0 %
    CPU: mcu2_1: TASK:       REMOTE_SRV:   0. 0 %
    CPU: mcu2_1: TASK:        LOAD_TEST:   0. 0 %
    CPU: mcu2_1: TASK:         TIVX_SDE:   0. 0 %
    CPU: mcu2_1: TASK:         TIVX_DOF:   0. 0 %
    CPU: mcu2_1: TASK:       TIVX_CPU_1:   0. 0 %
    CPU: mcu2_1: TASK:      IPC_TEST_RX:   0. 0 %
    CPU: mcu2_1: TASK:      IPC_TEST_TX:   0. 0 %
    CPU: mcu2_1: TASK:      IPC_TEST_TX:   0. 0 %
    CPU: mcu2_1: TASK:      IPC_TEST_TX:   0. 0 %
    CPU: mcu2_1: TASK:      IPC_TEST_TX:   0. 0 %
    CPU: mcu2_1: TASK:      IPC_TEST_TX:   0. 0 %
    
    CPU: mcu2_1: HEAP:   DDR_SHARED_MEM: size =   16777216 B, free =   16773376 B ( 99 % unused)
    CPU: mcu2_1: HEAP:           L3_MEM: size =     262144 B, free =     262144 B (100 % unused)
    
    CPU:  c6x_1: TASK:           IPC_RX:   0. 0 %
    CPU:  c6x_1: TASK:       REMOTE_SRV:   0. 0 %
    CPU:  c6x_1: TASK:        LOAD_TEST:   0. 0 %
    CPU:  c6x_1: TASK:         TIVX_CPU:   0. 0 %
    CPU:  c6x_1: TASK:      IPC_TEST_RX:   0. 0 %
    CPU:  c6x_1: TASK:      IPC_TEST_TX:   0. 0 %
    CPU:  c6x_1: TASK:      IPC_TEST_TX:   0. 0 %
    CPU:  c6x_1: TASK:      IPC_TEST_TX:   0. 0 %
    CPU:  c6x_1: TASK:      IPC_TEST_TX:   0. 0 %
    CPU:  c6x_1: TASK:      IPC_TEST_TX:   0. 0 %
    
    CPU:  c6x_1: HEAP:   DDR_SHARED_MEM: size =   16777216 B, free =   16773376 B ( 99 % unused)
    CPU:  c6x_1: HEAP:           L2_MEM: size =     229376 B, free =     229376 B (100 % unused)
    CPU:  c6x_1: HEAP:  DDR_SCRATCH_MEM: size =   50331648 B, free =   50331648 B ( 14 % unused)
    
    CPU:  c6x_2: TASK:           IPC_RX:   0. 0 %
    CPU:  c6x_2: TASK:       REMOTE_SRV:   0. 0 %
    CPU:  c6x_2: TASK:        LOAD_TEST:   0. 0 %
    CPU:  c6x_2: TASK:         TIVX_CPU:   0. 0 %
    CPU:  c6x_2: TASK:      IPC_TEST_RX:   0. 0 %
    CPU:  c6x_2: TASK:      IPC_TEST_TX:   0. 0 %
    CPU:  c6x_2: TASK:      IPC_TEST_TX:   0. 0 %
    CPU:  c6x_2: TASK:      IPC_TEST_TX:   0. 0 %
    CPU:  c6x_2: TASK:      IPC_TEST_TX:   0. 0 %
    CPU:  c6x_2: TASK:      IPC_TEST_TX:   0. 0 %
    
    CPU:  c6x_2: HEAP:   DDR_SHARED_MEM: size =   16777216 B, free =   16773376 B ( 99 % unused)
    CPU:  c6x_2: HEAP:           L2_MEM: size =     229376 B, free =     229376 B (100 % unused)
    CPU:  c6x_2: HEAP:  DDR_SCRATCH_MEM: size =   50331648 B, free =   50331648 B ( 14 % unused)
    
    CPU:  c7x_1: TASK:           IPC_RX:   0. 0 %
    CPU:  c7x_1: TASK:       REMOTE_SRV:   0. 0 %
    CPU:  c7x_1: TASK:        LOAD_TEST:   0. 0 %
    CPU:  c7x_1: TASK:      TIVX_CPU_PR:   0. 0 %
    CPU:  c7x_1: TASK:      TIVX_CPU_PR:   0. 0 %
    CPU:  c7x_1: TASK:      TIVX_CPU_PR:   0. 0 %
    CPU:  c7x_1: TASK:      TIVX_CPU_PR:   0. 0 %
    CPU:  c7x_1: TASK:      TIVX_CPU_PR:   0. 0 %
    CPU:  c7x_1: TASK:      TIVX_CPU_PR:   0. 0 %
    CPU:  c7x_1: TASK:      TIVX_CPU_PR:   0. 0 %
    CPU:  c7x_1: TASK:      TIVX_CPU_PR:   0. 0 %
    CPU:  c7x_1: TASK:      IPC_TEST_RX:   0. 0 %
    CPU:  c7x_1: TASK:      IPC_TEST_TX:   0. 0 %
    CPU:  c7x_1: TASK:      IPC_TEST_TX:   0. 0 %
    CPU:  c7x_1: TASK:      IPC_TEST_TX:   0. 0 %
    CPU:  c7x_1: TASK:      IPC_TEST_TX:   0. 0 %
    CPU:  c7x_1: TASK:      IPC_TEST_TX:   0. 0 %
    CPU:  c7x_1: TASK:      IPC_TEST_TX:   0. 0 %
    CPU:  c7x_1: TASK:      IPC_TEST_TX:   0. 0 %
    
    CPU:  c7x_1: HEAP:   DDR_SHARED_MEM: size =  268435456 B, free =  268435200 B (  3 % unused)
    CPU:  c7x_1: HEAP:           L3_MEM: size =    8159232 B, free =    8159232 B (100 % unused)
    CPU:  c7x_1: HEAP:           L2_MEM: size =     458752 B, free =     458752 B (100 % unused)
    CPU:  c7x_1: HEAP:           L1_MEM: size =      16384 B, free =      16384 B (100 % unused)
    CPU:  c7x_1: HEAP:  DDR_SCRATCH_MEM: size =  134217728 B, free =  134217728 B (  4 % unused)
    
    
    GRAPH:         graph_84 (#nodes =   6, #executions =    103)
     NODE:       CAPTURE1:                  node_97: avg =  13661 usecs, min/max =    140 /  49872 usecs, #executions =        103
     NODE:     VPAC_VISS1:          VISS_Processing: avg =  13983 usecs, min/max =  13721 /  14092 usecs, #executions =        103
     NODE:         IPU1-0:               2A_AlgNode: avg =  27446 usecs, min/max =  24190 /  32801 usecs, #executions =        103
     NODE:          CSITX:                  node_99: avg =  38977 usecs, min/max =  38176 /  42754 usecs, #executions =        103
     NODE:       DSS_M2M3:                 node_127: avg =  14374 usecs, min/max =  14261 /  14647 usecs, #executions =        103
     NODE:      VPAC_LDC1:           LDC_Processing: avg =  14594 usecs, min/max =  14290 /  15314 usecs, #executions =        103
    
     PERF:            TOTAL: avg =  39237 usecs, min/max =  32956 /  64635 usecs, #executions =        107
    
     PERF:            TOTAL:   25.48 FPS


     ==========================
     Demo : Single Camera w/ 2A
     ==========================
    
     p: Print performance statistics
    
     s: Save Sensor RAW, VISS Output and H3A output images to File System
    
     e: Export performance statistics
    
     u: Update DCC from File System
    
    
     x: Exit
    
     Enter Choice:
    Unsupported command


     ==========================
     Demo : Single Camera w/ 2A
     ==========================
    
     p: Print performance statistics
    
     s: Save Sensor RAW, VISS Output and H3A output images to File System
    
     e: Export performance statistics
    
     u: Update DCC from File System
    
    
     x: Exit
    
     Enter Choice: [MCU2_0]    811.860838 s: ==========================================================
    [MCU2_0]    811.860958 s:  Capture Status: Instance|0
    [MCU2_0]    811.860998 s: ==========================================================
    [MCU2_0]    811.861049 s:  overflowCount: 0
    [MCU2_0]    811.861086 s:  spuriousUdmaIntrCount: 0
    [MCU2_0]    811.861122 s:  frontFIFOOvflCount: 0
    [MCU2_0]    811.861157 s:  crcCount: 0
    [MCU2_0]    811.861190 s:  eccCount: 0
    [MCU2_0]    811.861225 s:  correctedEccCount: 0
    [MCU2_0]    811.861260 s:  dataIdErrorCount: 0
    [MCU2_0]    811.861296 s:  invalidAccessCount: 0
    [MCU2_0]    811.861332 s:  invalidSpCount: 0
    [MCU2_0]    811.861373 s:  strmFIFOOvflCount[0]: 0
    [MCU2_0]    811.861403 s:  Channel Num | Frame Queue Count | Frame De-queue Count | Frame Drop Count | Error Frame Count |
    [MCU2_0]    811.861480 s:            0 |               112 |                  110 |               17 |                 0 |
    [MCU2_0]    812.851971 s: CpswCpts_ioctl: Eth RX event not found (msgType=2, seqId=12083, dom=0, portNum=1)
    [MCU2_0]    812.852065 s: EnetPer_ioctl: cpsw9g: Failed to do IOCTL cmd 0x01000306: -14
    [MCU2_0]    844.428886 s: CpswCpts_ioctl: Eth RX event not found (msgType=2, seqId=12083, dom=0, portNum=1)
    p
    
    
    Summary of CPU load,
    ====================
    
    CPU: mpu1_0: TOTAL LOAD =   0.24 % ( HWI =   0. 4 %, SWI =   0. 0 % )
    CPU: mcu2_0: TOTAL LOAD =  54. 0 % ( HWI =   0. 0 %, SWI =   0. 0 % )
    CPU: mcu2_1: TOTAL LOAD =   1. 0 % ( HWI =   0. 0 %, SWI =   0. 0 % )
    CPU:  c6x_1: TOTAL LOAD =   0. 0 % ( HWI =   0. 0 %, SWI =   0. 0 % )
    CPU:  c6x_2: TOTAL LOAD =   1. 0 % ( HWI =   0. 0 %, SWI =   0. 0 % )
    CPU:  c7x_1: TOTAL LOAD =   1. 0 % ( HWI =   0. 0 %, SWI =   0. 0 % )
    
    
    HWA performance statistics,
    ===========================
    
    HWA:   VISS: LOAD =  33.54 % ( 206 MP/s )
    HWA:   LDC : LOAD =  35.88 % ( 206 MP/s )
    
    
    DDR performance statistics,
    ===========================
    
    DDR: READ  BW: AVG =   2619 MB/s, PEAK =   7429 MB/s
    DDR: WRITE BW: AVG =   1851 MB/s, PEAK =   6000 MB/s
    DDR: TOTAL BW: AVG =   4470 MB/s, PEAK =  13429 MB/s
    
    
    Detailed CPU performance/memory statistics,
    ===========================================
    
    CPU: mcu2_0: TASK:           IPC_RX:   0.25 %
    CPU: mcu2_0: TASK:       REMOTE_SRV:   0. 0 %
    CPU: mcu2_0: TASK:        LOAD_TEST:   0. 0 %
    CPU: mcu2_0: TASK:       TIVX_CPU_0:  19.87 %
    CPU: mcu2_0: TASK:          TIVX_NF:   0. 0 %
    CPU: mcu2_0: TASK:        TIVX_LDC1:   1. 1 %
    CPU: mcu2_0: TASK:        TIVX_MSC1:   0. 0 %
    CPU: mcu2_0: TASK:        TIVX_MSC2:   0. 0 %
    CPU: mcu2_0: TASK:       TIVX_VISS1:   3. 1 %
    CPU: mcu2_0: TASK:       TIVX_CAPT1:   0.95 %
    CPU: mcu2_0: TASK:       TIVX_CAPT2:   0. 0 %
    CPU: mcu2_0: TASK:       TIVX_DISP1:   0. 0 %
    CPU: mcu2_0: TASK:       TIVX_DISP2:   0. 0 %
    CPU: mcu2_0: TASK:       TIVX_CSITX:   1.19 %
    CPU: mcu2_0: TASK:       TIVX_CAPT3:   0. 0 %
    CPU: mcu2_0: TASK:       TIVX_CAPT4:   0. 0 %
    CPU: mcu2_0: TASK:       TIVX_CAPT5:   0. 0 %
    CPU: mcu2_0: TASK:       TIVX_CAPT6:   0. 0 %
    CPU: mcu2_0: TASK:       TIVX_CAPT7:   0. 0 %
    CPU: mcu2_0: TASK:       TIVX_CAPT8:   0. 0 %
    CPU: mcu2_0: TASK:      TIVX_DISP_M:   0. 0 %
    CPU: mcu2_0: TASK:      TIVX_DISP_M:   0. 0 %
    CPU: mcu2_0: TASK:      TIVX_DISP_M:   1.44 %
    CPU: mcu2_0: TASK:      TIVX_DISP_M:   0. 0 %
    
    CPU: mcu2_0: HEAP:   DDR_SHARED_MEM: size =   16777216 B, free =   16293120 B ( 97 % unused)
    CPU: mcu2_0: HEAP:           L3_MEM: size =     262144 B, free =     261888 B ( 99 % unused)
    
    CPU: mcu2_1: TASK:           IPC_RX:   0. 0 %
    CPU: mcu2_1: TASK:       REMOTE_SRV:   0. 0 %
    CPU: mcu2_1: TASK:        LOAD_TEST:   0. 0 %
    CPU: mcu2_1: TASK:         TIVX_SDE:   0. 0 %
    CPU: mcu2_1: TASK:         TIVX_DOF:   0. 0 %
    CPU: mcu2_1: TASK:       TIVX_CPU_1:   0. 0 %
    CPU: mcu2_1: TASK:      IPC_TEST_RX:   0. 0 %
    CPU: mcu2_1: TASK:      IPC_TEST_TX:   0. 0 %
    CPU: mcu2_1: TASK:      IPC_TEST_TX:   0. 0 %
    CPU: mcu2_1: TASK:      IPC_TEST_TX:   0. 0 %
    CPU: mcu2_1: TASK:      IPC_TEST_TX:   0. 0 %
    CPU: mcu2_1: TASK:      IPC_TEST_TX:   0. 0 %
    
    CPU: mcu2_1: HEAP:   DDR_SHARED_MEM: size =   16777216 B, free =   16773376 B ( 99 % unused)
    CPU: mcu2_1: HEAP:           L3_MEM: size =     262144 B, free =     262144 B (100 % unused)
    
    CPU:  c6x_1: TASK:           IPC_RX:   0. 0 %
    CPU:  c6x_1: TASK:       REMOTE_SRV:   0. 0 %
    CPU:  c6x_1: TASK:        LOAD_TEST:   0. 0 %
    CPU:  c6x_1: TASK:         TIVX_CPU:   0. 0 %
    CPU:  c6x_1: TASK:      IPC_TEST_RX:   0. 0 %
    CPU:  c6x_1: TASK:      IPC_TEST_TX:   0. 0 %
    CPU:  c6x_1: TASK:      IPC_TEST_TX:   0. 0 %
    CPU:  c6x_1: TASK:      IPC_TEST_TX:   0. 0 %
    CPU:  c6x_1: TASK:      IPC_TEST_TX:   0. 0 %
    CPU:  c6x_1: TASK:      IPC_TEST_TX:   0. 0 %
    
    CPU:  c6x_1: HEAP:   DDR_SHARED_MEM: size =   16777216 B, free =   16773376 B ( 99 % unused)
    CPU:  c6x_1: HEAP:           L2_MEM: size =     229376 B, free =     229376 B (100 % unused)
    CPU:  c6x_1: HEAP:  DDR_SCRATCH_MEM: size =   50331648 B, free =   50331648 B ( 14 % unused)
    
    CPU:  c6x_2: TASK:           IPC_RX:   0. 0 %
    CPU:  c6x_2: TASK:       REMOTE_SRV:   0. 0 %
    CPU:  c6x_2: TASK:        LOAD_TEST:   0. 0 %
    CPU:  c6x_2: TASK:         TIVX_CPU:   0. 0 %
    CPU:  c6x_2: TASK:      IPC_TEST_RX:   0. 0 %
    CPU:  c6x_2: TASK:      IPC_TEST_TX:   0. 0 %
    CPU:  c6x_2: TASK:      IPC_TEST_TX:   0. 0 %
    CPU:  c6x_2: TASK:      IPC_TEST_TX:   0. 0 %
    CPU:  c6x_2: TASK:      IPC_TEST_TX:   0. 0 %
    CPU:  c6x_2: TASK:      IPC_TEST_TX:   0. 0 %
    
    CPU:  c6x_2: HEAP:   DDR_SHARED_MEM: size =   16777216 B, free =   16773376 B ( 99 % unused)
    CPU:  c6x_2: HEAP:           L2_MEM: size =     229376 B, free =     229376 B (100 % unused)
    CPU:  c6x_2: HEAP:  DDR_SCRATCH_MEM: size =   50331648 B, free =   50331648 B ( 14 % unused)
    
    CPU:  c7x_1: TASK:           IPC_RX:   0. 0 %
    CPU:  c7x_1: TASK:       REMOTE_SRV:   0. 0 %
    CPU:  c7x_1: TASK:        LOAD_TEST:   0. 0 %
    CPU:  c7x_1: TASK:      TIVX_CPU_PR:   0. 0 %
    CPU:  c7x_1: TASK:      TIVX_CPU_PR:   0. 0 %
    CPU:  c7x_1: TASK:      TIVX_CPU_PR:   0. 0 %
    CPU:  c7x_1: TASK:      TIVX_CPU_PR:   0. 0 %
    CPU:  c7x_1: TASK:      TIVX_CPU_PR:   0. 0 %
    CPU:  c7x_1: TASK:      TIVX_CPU_PR:   0. 0 %
    CPU:  c7x_1: TASK:      TIVX_CPU_PR:   0. 0 %
    CPU:  c7x_1: TASK:      TIVX_CPU_PR:   0. 0 %
    CPU:  c7x_1: TASK:      IPC_TEST_RX:   0. 0 %
    CPU:  c7x_1: TASK:      IPC_TEST_TX:   0. 0 %
    CPU:  c7x_1: TASK:      IPC_TEST_TX:   0. 0 %
    CPU:  c7x_1: TASK:      IPC_TEST_TX:   0. 0 %
    CPU:  c7x_1: TASK:      IPC_TEST_TX:   0. 0 %
    CPU:  c7x_1: TASK:      IPC_TEST_TX:   0. 0 %
    CPU:  c7x_1: TASK:      IPC_TEST_TX:   0. 0 %
    CPU:  c7x_1: TASK:      IPC_TEST_TX:   0. 0 %
    
    CPU:  c7x_1: HEAP:   DDR_SHARED_MEM: size =  268435456 B, free =  268435200 B (  3 % unused)
    CPU:  c7x_1: HEAP:           L3_MEM: size =    8159232 B, free =    8159232 B (100 % unused)
    CPU:  c7x_1: HEAP:           L2_MEM: size =     458752 B, free =     458752 B (100 % unused)
    CPU:  c7x_1: HEAP:           L1_MEM: size =      16384 B, free =      16384 B (100 % unused)
    CPU:  c7x_1: HEAP:  DDR_SCRATCH_MEM: size =  134217728 B, free =  134217728 B (  4 % unused)
    
    
    GRAPH:         graph_84 (#nodes =   6, #executions =   1027)
     NODE:       CAPTURE1:                  node_97: avg =   6573 usecs, min/max =    135 /  49872 usecs, #executions =       1027
     NODE:     VPAC_VISS1:          VISS_Processing: avg =  13988 usecs, min/max =  13721 /  14621 usecs, #executions =       1027
     NODE:         IPU1-0:               2A_AlgNode: avg =  27979 usecs, min/max =  24190 /  34718 usecs, #executions =       1027
     NODE:          CSITX:                  node_99: avg =  38705 usecs, min/max =  38044 /  42754 usecs, #executions =       1027
     NODE:       DSS_M2M3:                 node_127: avg =  14373 usecs, min/max =  14246 /  14903 usecs, #executions =       1027
     NODE:      VPAC_LDC1:           LDC_Processing: avg =  14608 usecs, min/max =  14263 /  15314 usecs, #executions =       1027
    
     PERF:            TOTAL: avg =  40332 usecs, min/max =  38584 /  43513 usecs, #executions =        924
    
     PERF:            TOTAL:   24.79 FPS


     ==========================
     Demo : Single Camera w/ 2A
     ==========================
    
     p: Print performance statistics
    
     s: Save Sensor RAW, VISS Output and H3A output images to File System
    
     e: Export performance statistics
    
     u: Update DCC from File System
    
    
     x: Exit
    
     Enter Choice:
    Unsupported command


     ==========================
     Demo : Single Camera w/ 2A
     ==========================
    
     p: Print performance statistics
    
     s: Save Sensor RAW, VISS Output and H3A output images to File System
    
     e: Export performance statistics
    
     u: Update DCC from File System
    
    
     x: Exit
    
     Enter Choice: [MCU2_0]    849.128796 s: ==========================================================
    [MCU2_0]    849.128913 s:  Capture Status: Instance|0
    [MCU2_0]    849.128953 s: ==========================================================
    [MCU2_0]    849.129003 s:  overflowCount: 0
    [MCU2_0]    849.129037 s:  spuriousUdmaIntrCount: 0
    [MCU2_0]    849.129074 s:  frontFIFOOvflCount: 0
    [MCU2_0]    849.129110 s:  crcCount: 0
    [MCU2_0]    849.129142 s:  eccCount: 0
    [MCU2_0]    849.129175 s:  correctedEccCount: 0
    [MCU2_0]    849.129210 s:  dataIdErrorCount: 0
    [MCU2_0]    849.129244 s:  invalidAccessCount: 0
    [MCU2_0]    849.129280 s:  invalidSpCount: 0
    [MCU2_0]    849.129320 s:  strmFIFOOvflCount[0]: 0
    [MCU2_0]    849.129352 s:  Channel Num | Frame Queue Count | Frame De-queue Count | Frame Drop Count | Error Frame Count |
    [MCU2_0]    849.129431 s:            0 |              1036 |                 1034 |              211 |                 0 |
    x
    
       850.650085 s: ISS: Stopping sensor [OX08B40_RAW_MAX96717] ... !!!
    [MCU2_0]    850.650336 s: ImageSensor_RemoteServiceHandler: IM_SENSOR_CMD_STREAM_OFF
    [MCU2_0]    850.650425 s: IM_SENSOR_CMD_STREAM_OFF:  channel_mask = 0x1
    [MCU2_0]    850.650489 s: Stop streaming
       850.803876 s: ISS: Stopping sensor [OX08B40_RAW_MAX96717] ... Done !!!
       850.854857 s: ISS: Stopping sensor [OX08B40_RAW_MAX96717] ... !!!
    [MCU2_0]    850.855199 s: ImageSensor_RemoteServiceHandler: IM_SENSOR_CMD_STREAM_OFF
    [MCU2_0]    850.855284 s: IM_SENSOR_CMD_STREAM_OFF:  channel_mask = 0x1
    [MCU2_0]    850.855341 s: Stop streaming
       851.008934 s: ISS: Stopping sensor [OX08B40_RAW_MAX96717] ... Done !!!
    app_run_graph done
    releasing capture node
    releasing csitx node
    releasing node_viss
    releasing node_aewb
    releasing m2m_node
    releasing raw image done
    releasing cap_frame # 0
    releasing cap_frame # 1
    releasing cap_frame # 2
    releasing cap_frame # 3
    releasing cap_frame # 4
    releasing csitx_frames
    releasing h3a_stats_arr
    releasing out_dss_rgb_arr
    releasing y12
    releasing uv12_c1
    releasing s8_b8_c4
    releasing y8_r8_c2
    releasing histogram
    releasing configuration
    releasing m2m_config
    releasing ae_awb_result done
    releasing h3a_aew_af
    releasing aewb_config
    releasing VISS DCC Data Object
    releasing 2A DCC Data Object
    releasing LDC Mesh Image
    releasing LDC Output Image
    releasing LDC Mesh Parameters Object
    releasing LDC Parameters Object
    releasing LDC Region Parameters Object
    releasing LDC Node
    releasing graph
    [MCU2_0]    851.151102 s: ==========================================================
    [MCU2_0]    851.151209 s:  Capture Status: Instance|0
    [MCU2_0]    851.151247 s: ==========================================================
    [MCU2_0]    851.151296 s:  overflowCount: 0
    [MCU2_0]    851.151331 s:  spuriousUdmaIntrCount: 0
    [MCU2_0]    851.151368 s:  frontFIFOOvflCount: 0
    [MCU2_0]    851.151402 s:  crcCount: 0
    [MCU2_0]    851.151433 s:  eccCount: 0
    [MCU2_0]    851.151466 s:  correctedEccCount: 0
    [MCU2_0]    851.151502 s:  dataIdErrorCount: 0
    [MCU2_0]    851.151537 s:  invalidAccessCount: 0
    [MCU2_0]    851.151573 s:  invalidSpCount: 0
    [MCU2_0]    851.151680 s:  strmFIFOOvflCount[0]: 0
    [MCU2_0]    851.151718 s:  Channel Num | Frame Queue Count | Frame De-queue Count | Frame Drop Count | Error Frame Count |
    [MCU2_0]    851.151826 s:            0 |              1068 |                 1068 |              224 |                 0 |
    [MCU2_0]    851.153372 s: ==========================================================
    [MCU2_0]    851.153479 s:  Display M2M Status: Instance|0
    [MCU2_0]    851.153517 s: ==========================================================
    [MCU2_0]    851.153567 s:  Queue Count: 1066
    [MCU2_0]    851.153603 s:  De-queue Count: 1066
    [MCU2_0]    851.153640 s:  Write-back Frames Count: 1066
    [MCU2_0]    851.153677 s:  Underflow Count: 0
    [MCU2_0]    851.154172 s: ==========================================================
    [MCU2_0]    851.154266 s:  Csitx Status: Instance|0
    [MCU2_0]    851.154301 s: ==========================================================
    [MCU2_0]    851.154350 s:  FIFO Overflow Count: 0
    [MCU2_0]    851.154382 s:   Channel Num | Frame Queue Count | Frame De-queue Count | Frame Repeat Count |
    [MCU2_0]    851.154446 s:               0|              1066|           1066|           0|
    releasing graph done
    app_delete_graph done
    tivxHwaUnLoadKernels done
    tivxImagingUnLoadKernels done
       851.159843 s:  VX_ZONE_WARNING:[vxReleaseContext:1050] Found a reference 0xf172d8 of type 00000813 at external count 1, internal count 0, releasing it
       851.159855 s:  VX_ZONE_WARNING:[vxReleaseContext:1052] Releasing reference (name=object_array_109) now as a part of garbage collection
       851.159898 s:  VX_ZONE_WARNING:[vxReleaseContext:1050] Found a reference 0xf17478 of type 00000813 at external count 1, internal count 0, releasing it
       851.159912 s:  VX_ZONE_WARNING:[vxReleaseContext:1052] Releasing reference (name=object_array_111) now as a part of garbage collection
       851.159942 s:  VX_ZONE_WARNING:[vxReleaseContext:1050] Found a reference 0xf17618 of type 00000813 at external count 1, internal count 0, releasing it
       851.159953 s:  VX_ZONE_WARNING:[vxReleaseContext:1052] Releasing reference (name=object_array_115) now as a part of garbage collection
       851.159983 s:  VX_ZONE_WARNING:[vxReleaseContext:1050] Found a reference 0xf177b8 of type 00000813 at external count 1, internal count 0, releasing it
       851.159994 s:  VX_ZONE_WARNING:[vxReleaseContext:1052] Releasing reference (name=object_array_119) now as a part of garbage collection
       851.160036 s:  VX_ZONE_WARNING:[vxReleaseContext:1050] Found a reference 0xeb0318 of type 0000080f at external count 1, internal count 0, releasing it
       851.160047 s:  VX_ZONE_WARNING:[vxReleaseContext:1052] Releasing reference (name=image_126) now as a part of garbage collection
    vxReleaseContext done
    app_deinit done
       851.160118 s: ISS: De-initializing sensor [OX08B40_RAW_MAX96717] ... !!!
       851.160467 s: ISS: De-initializing sensor [OX08B40_RAW_MAX96717] ... Done !!!
       851.160482 s:  VX_ZONE_INIT:[tivxHostDeInitLocal:100] De-Initialization Done for HOST !!!
       851.164853 s:  VX_ZONE_INIT:[tivxDeInitLocal:193] De-Initialization Done !!!
    APP: Deinit ... !!!
    REMOTE_SERVICE: Deinit ... !!!
    REMOTE_SERVICE: Deinit ... Done !!!
    IPC: Deinit ... !!!
    IPC: DeInit ... Done !!!
    MEM: Deinit ... !!!
    MEM: Alloc's: 34 alloc's of 206247268 bytes
    MEM: Free's : 34 free's  of 206247268 bytes
    MEM: Open's : 0 allocs  of 0 bytes
    MEM: Deinit ... Done !!!
    APP: Deinit ... Done !!!

    Thanks,

    Annie

  • app_single_cam_capture_csitx.vcd.html app_single_cam_capture_csitx.html

    When the ldc node and m2m node are removed, the csitx is slightly more than 33.3ms, and the frame is still lost. Changing CSITX_LANE_SPEED_MBPS to a larger value also does not improve the csitx send time. However, reducing the value of CSITX_LANE_SPEED_MBPS will increase the csitx sending time.

    Thanks,

    Annie

  • Hi Annie,

    Looking at the stats, yes, the fps drop seems to be because of the CSITX node.

     NODE:          CSITX:                  node_99: avg =  38977 usecs, min/max =  38176 /  42754 usecs, #executions =        103

     NODE:          CSITX:                  node_99: avg =  38705 usecs, min/max =  38044 /  42754 usecs, #executions =       1027

    Calculating the required lane speed, i would around 4.5Gbps total, so setting 1Gbps per lane would not be sufficient, can you please try setting 1.5Gbps lane speed?

    Regards,

    Brijesh

  • Hi Hi Brijesh,

    The customer has tried different channel speed settings. The value of CSITX_LANE_SPEED_MBPS is set to 900 is the dividing point. 

    If it is higher than 900, it will not improve the sending speed of the csitx node.

    If it is lower than 900, such as 800, 700, etc., it will significantly reduce the sending speed of csitxnode, which will lead to longer sending time of each frame.

    The customer has tested the speed to 2200, which is the same as the setting of 1000; just tested the setting to 1.5G, which is 1500, and the result is the same.

    Thanks,

    Annie

  • Hi  Brijesh,

    May I know your suggestion for above following question?

    Thanks,

    Annie

  • Hi Annie,

    Are you using SDK8.0 or later revisions? Because on SDK7.3, there were only few lane speeds supported. 

    Regards,

    Brijesh

  • Hi Brijesh,

    it is SDK 8.1. Is there a way to confirm the speed supported by the current version?

    Thanks,

    Annie

  • Hi ,

    SDK8.1 does support various lane speed. For your case, can you please try 1.5Gbps lane speed and see if it helps improving CSITX performance? 

    Regards,

    Brijesh

  • Hi Brijesh,

    When the 1.5Gbps Lane speed was proposed before, customers tried it. Customer has tried various speeds, but it seems that 900M is the upper limit. After more than 900M, the performance of csitx will no longer increase with the increase of lane speed.

    Thanks,

    Annie

  • Hi ,

    What all other masters running in the system? Because lets says if DDR BW has reached to the peak, then it will not be able to transfer at faster speed. 

    Can you please try running just CSITX with 1.5Gbps and see if it works? 

    Regards,

    Brijesh

  • Hi Brijesh,

    No other programs are running in the system, only this one pipeline is running. This pipeline node information client has previously submitted.


    app_only_csitx.7z.html

    The above attachment is the influence of the value of band lane speed on csitx transmission when the customer tests only csitx. It seems that the speed limit is set at 1000M. Further increase does not improve the sending speed of csitx. Among them, at 500Mbps, each frame is about 55ms, and at 1000Mbps, 1.5Gbps, and 2.4Gbps, each frame is about 29ms. basically the same. 

    Thanks,

    Annie

  • Hi Annie,

    I see you are using CSIRX + VISS + LDC + DSS M2M + CSITX for such high resolution. In addition, the nodes are replicated, which mean the graph is running for multiple channels, looks like 4 channel. Can you please do some pen+paper calculation of DDR BW for this usecase? I suspect you might be reaching to the edge of the maximum supported BW. 

    Regards,

    Brijesh

  • Hi Brijesh,

    DDR performance statistics,
    ===========================

    DDR: READ BW: AVG = 2619 MB/s, PEAK = 7429 MB/s
    DDR: WRITE BW: AVG = 1851 MB/s, PEAK = 6000 MB/s
    DDR: TOTAL BW: AVG = 4470 MB/s, PEAK = 13429 MB/s

    Thanks,

    Annie

  • Hi Annie,

    Can you please try removing one of the nodes, lets say LDC, and see if the performance improves? I am suspecting that due to high peak BW, its delaying the frames.. 

    Regards,

    Brijesh