- Ask a related questionWhat is a related question?A related question is a question created from another question. When the related question is created, it will be automatically linked to the original question.

Hello
I have a custom am64 hsfs board with same flash chip with evm board. when i tried to use sbl_ospi to load my application. I wrote the sbl and appimage in flash using uart uniflash and set to bootmode pins to xspi bootmode (Reffered OSPI in sdk getting started page). When powering up the board nothing written on uart terminal and when i debug the sbl, its stuck at some address after warm reset workaround (prevent cpsw lockup).
I tried to bootmode pin 9 (SFDP) to low or disable reset workaround board works normally.
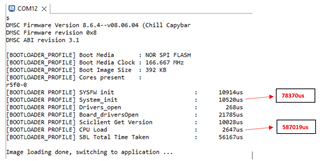
But cpu load time in my board is 500ms, EVM board is 35ms (for 370kb same appimage).
what can be cause to this issue.
I can able to print SFDP table using ospi_diag example and compare it to the EVM's SFDP table, they are exactly same.
I am using sdk 8.6 and i tried with sdk 9's sbl_ospi. Both of them work same.
Regard,
Berlam