This thread has been locked.
If you have a related question, please click the "Ask a related question" button in the top right corner. The newly created question will be automatically linked to this question.
Tool/software:
Hi
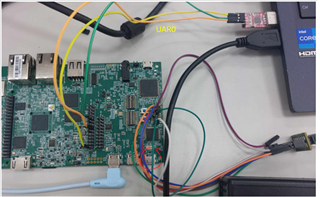
I want to use the DDR Margin Test Tool on the AM62x-SK-EVM for testing, but I encountered an issue in the red step while following the readme.txt instructions.
Steps 1 to 4 executed normally, but I encountered issues with Step 5, Step 6.a, and Step 6.b. as shown below.
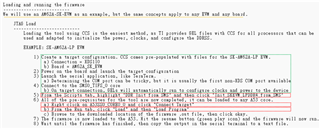
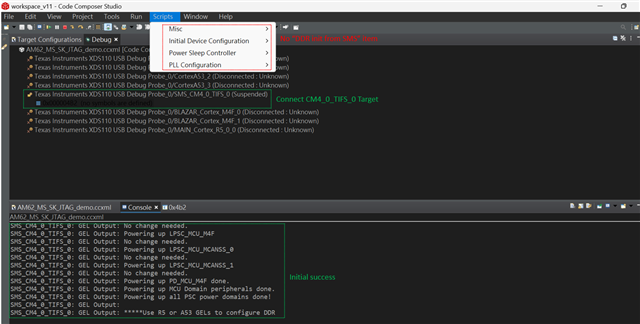
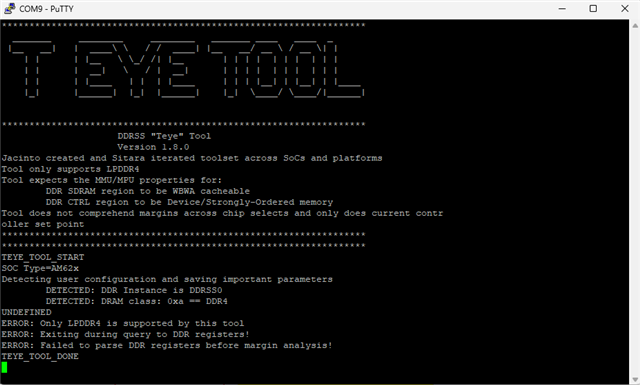
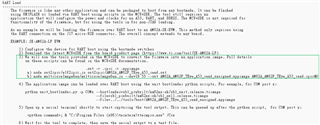
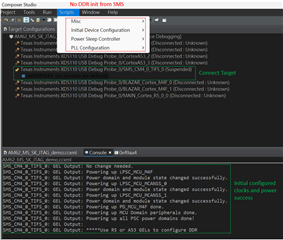
Step 5: Did not see the option "DDR int from SMS".
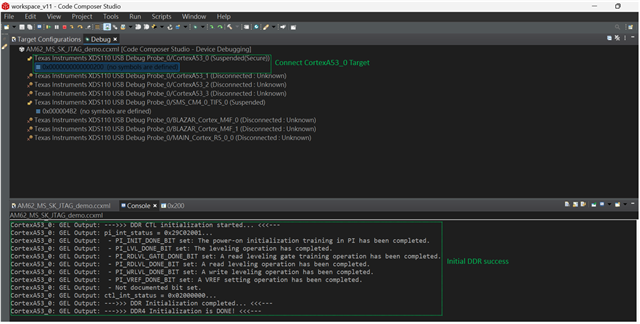
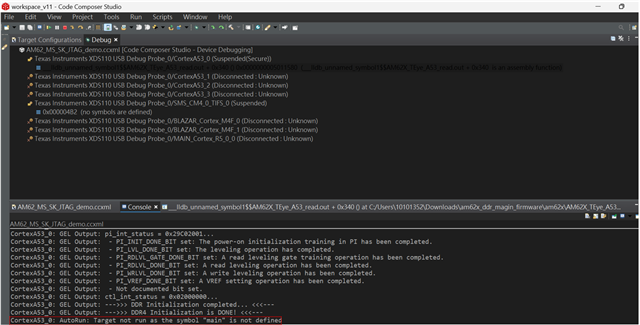
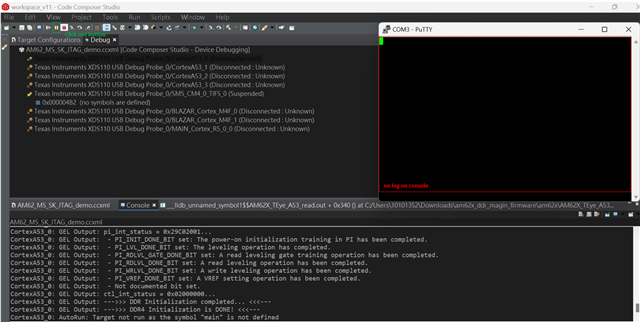
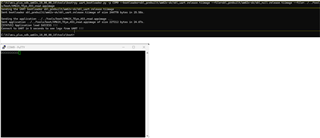
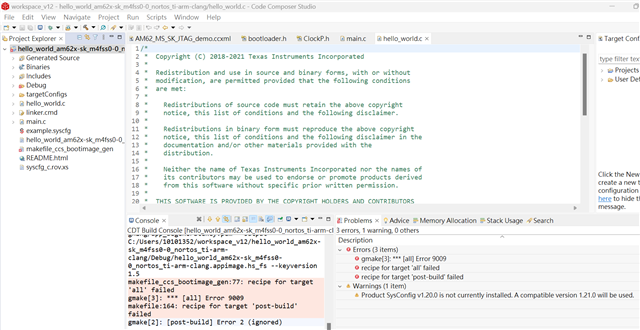
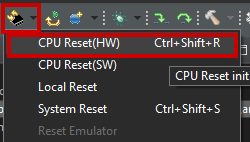
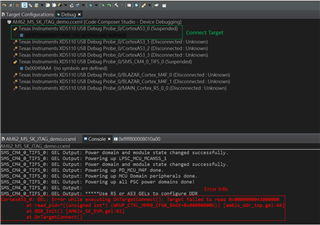
Step 6.a: When selecting to connect to CortexA53_0, an exception warning occurs as follows.
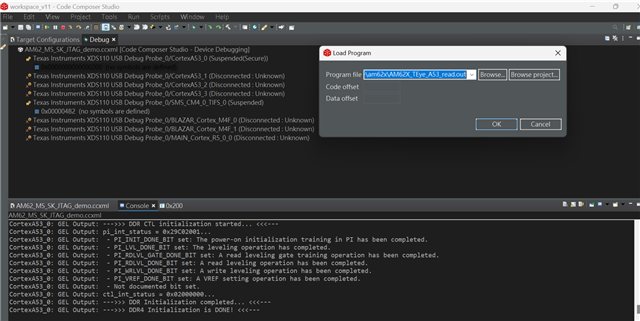
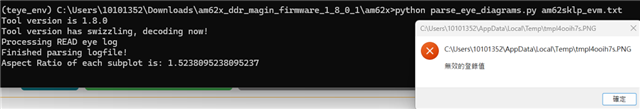
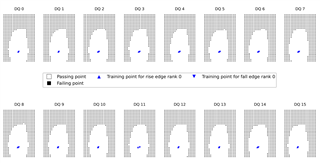
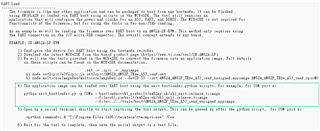
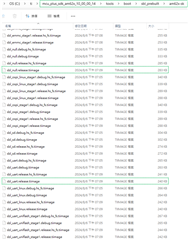
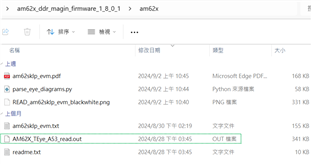
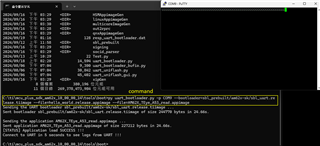
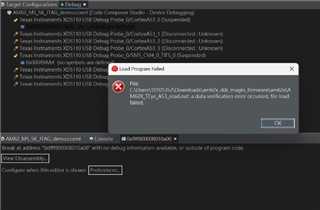
Step 6.b: Selecting the margin test file AM62X_TEye_A53_read.out
results in a loading failure.
Could explain what issues I might be encountering?
sincerely grateful
P.S : DDR Margin Test Tool link: https://www.ti.com/tool/download/DDR-MARGIN-FW/1.8.0
Greetings Chunyen,
The examples are for an AM62A EVM, it's possible the options for the AM62 EVM are named a little different. It's just a matter of finding the correct GEL for AM62x and calling it. A couple of questions:
Sincerely,
Lucas
Hi Lucas,
1.My CCS version is as follows
2.I changed the Bootmode to the following settings, and I was able to connect to the A53 successfully, avoiding the issues in
steps 6.a and 6.b mentioned earlier.
However, I'm still unable to receive logs on UART0 after loading and executing TEye_A53_read.out
.
Could you help me check if there's anything wrong with my execution flow?
(1) Step 1: Successfully connected to the SMS_CM_0_TIFS_0
core, but still don't see the "DDR init from SMS" item
in the Script tag.
(2) Step 2: Successfully connected to the CortexA53_0
core.
(3) Step 3: Selected to load TEye_A53_read.out
.
(4) Step 4: After clicking OK to load, the CCS Console displays "Target not run as symbol 'main' is not defined." I'm not sure if
this is normal.
(5) Step 5: Clicked the Run Button, but no log appeared on Putty. I suspect the program did not execute successfully.
My operational environment and connections are as follows:
Here is my connection environment
3.I'm more familiar with the CCS interface, so I'd like to try using CCS first. If it still doesn't work, I will consider using the command line method.
sincerely grateful
Hi Lucas:
By the way, is there a demo video available for the DDR Margin Test Tool related to the AM62x-SK-EVM? That would be very helpful for me
sincerely grateful
Greetings Chunyen,
This tool does not support DDR4, it only supports LPDDR4. You would need an SK-AM62-LP EVM to evaluate it fully.
That being said, you should still be able to see the output that tells you the tool does not support DDR4. Two things:
Sincerely,
Lucas
Hi Lucus,
Thank you so much for your assistance! I was able to receive the log successfully by simply changing
the debug port to output from the J15 micro USB. The results are as follows:
It seems that the AM62x-SK-EVM indeed does not support DDR Margin Tool testing. I will apply to TI
for an SK-AM62-LP EVM for testing.
Also, could you provide us with a test result file that has successfully utilized the Margin Tool? Our
product aims to implement a DDR testing tool, and we want to evaluate whether the results produced
by the Margin Tool align with our expected testing objectives.
sincerely grateful
Greetings Chunyen,
Please see the log attached that I got from an AM62-SK-LP EVM I borrowed. You can use this file with the python script supplied to generate a .pdf report.
Sincerely,
Lucas
Hi Lucas
When running the analysis test results, I encountered the following error window. I would like to confirm if this is a normal occurrence.
Because of this error window, I'm not sure if the generated am62sklp_evm.pdf
is complete. Could you help me verify this?
Additionally, is there any related documentation that I can refer to for understanding how to interpret this am62sklp_evm.pdf
report?
sincerely,
Chunyen
Greetings Chunyen,
I can't understand the error message, but this is not a normal occurrence. Judging from the filename, maybe it's related to the temporary image generated by the tool?
Can you try commented out lines 983, 987-990 of the script? Should look like below
983 #plt.savefig(imgname + ".png", dpi=1000) 984 pp.savefig(f1) 985 #plt.show() 986 plt.close(f1) 987 #if once ==0: 988 #img = Image.open(imgname + ".png") 989 #img.show() 990 #once =1
I've attached the pdf output from the logfile for reference as well.0878.am62sklp_evm.pdf
Sincerely,
Lucas
Hi Lucus:
I commented out lines 983, 987-990, and indeed the error no longer occurs. Will this affect the analysis results?
Also, how should I interpret these two figures? What values would be considered good?
Is there more detailed documentation I can refer to?
sincerely,
Chunyen
Greetings Chunyen,
It does not change the analysis results by commenting out those lines, they just have to do with some image creation.
The tool sweeps VREF and delay settings for each bit, the first figure visually shows the eye produced. The blue triangles show the training combination the hardware arrived at. The second figure details the size of the tallest and widest openings of each bit's eye, along with how many points are passing that the tool saw. Deciding what values are good will depend on your operating frequency and your business' design goals, as the eye is affected by board design and DRAM choice. A wider eye is always better, but at times it can be a tradeoff to get a more convienient/cheaper board design that comes at the expense of some margin.
There is no detailed documentation currently, but this is planned for the future.
Sincerely,
Lucas
Lucas,
I took a SK-AM62A-LP but I encounter problem in step 4, I have no way to connect SMS0_TIFS_0 core even with NO BOOT mode.
4) Connect to the SMS0_TIFS_0 core
b) On target connection, GELs will automatically run to configure clocks and power to the device
I took SKAM62-LP and found same problem which SMS_CM4_0_TIFS_0 cannot be connected either. No matter in No Boot or even boot Linux completely.
Is there a script or special GEL need to be run before I can connecting this core?
I am using CCS 12.8.
One different is AM62x and AM62A EVM I use are all HS-FS device. AM62x GP EVM seems not have this problem.
BR, Rich
Greetings Rich,
Please post a separate ticket since this is a different train of discussion. My immediate thought is that is expected behavior for an HS-FS device and for you to refer to the second example in the readme, "UART load" for your case. Since you have an HS-FS device you would be using the hs_fs version of the images in the MCU+SDK to enable power+clocks and DDR configuration, after which the tool will be loaded.
Sincerely,
Lucas
Hi Lucus,
I am using the UART Load method by referring to the steps in the green box.
I was able to successfully download the SBL and appimage to the AM62x-SK-EVM via UART, as shown in the picture below.
When the log shows "Connect to UART in 5 seconds to see logs from UART," I open Putty. After that, I see the screen continuously outputting
"CCCCCCC." Could this issue occur after loading the SPL file and during the SBL execution phase? Or is there another possible cause?
By the way, my development board is a GP (General Purpose) device.
The sbl_uart.release.tiimage
and sbl_null.release.tiimage
are from the existing files in MCU+SDK, not built by myself. The file paths are as
follows.
For the AM62X_TEye_A53_read.appimage
, I converted the AM62X_TEye_A53_read.out
from the Margin Tool folder into this image using the steps in the
green box
.
Sincerely,
Chunyen
Greetings Chunyen,
It is likely some subtle thing with the SDK.
Can you try these options:
--bootloader=sbl_prebuilt/am62x-sk/sbl_uart.release.tiimage --file=../../examples/hello_world/am62x-sk/m4fss0-0_nortos/ti-arm-clang/hello_world.release.appimage --file=AM62X_TEye_A53_read.appimage
Sincerely,
Lucas
Hi Lucas,
I couldn't find the hello_world.release.appimage
in the specified path.
Also, I tried opening the hello_world
project, but I couldn't compile it successfully. I'm not sure what the issue might be.
Could you provide a hello_world.release.appimage
for me to quickly debug the problem?
Sincerely,
Chunyen
Greetings Chunyen,
You may need to run make at the top level of the SDK to have all the images be generated, see: https://software-dl.ti.com/mcu-plus-sdk/esd/AM62X/10_00_00_14/exports/docs/api_guide_am62x/EVM_SETUP_PAGE.html#EVM_FLASH_SOC_INIT
I've attached the image from the am62x-sk folder I have.
Sincerely,
Lucas
Hi Lucas :
When the message 'Connect to UART in 5 seconds to see logs from UART' is displayed, I opened the Putty terminal, but I still didn't see the 'HelloWorld'
string output. Instead, it keeps showing 'CCCCC.' Also, I tried connecting via JTAG, but I couldn't connect to the A53 core either. Is it possible that the
sbl_uart.release.tiimage didn't execute successfully, and it also failed to load and run the hello_world.release.appimage?
Is there any demo video available for reference that shows a successful execution?
Sincerely,
Chunyen
Greetings Chunyen,
At this point these are more SDK related questions than about the tool and I'm not familiar enough to debug this unfortunately (I also do not have access to my boards for the next couple of weeks, so I cannot try things). I would recommend posting a new targeted ticket about the behavior you're seeing to get the right SDK expert's input. Once those fundamental issues are solved you should be able to load almost any code via the UART bootloader script (not just the margin firmware).
Sincerely,
Lucas
Lucas,
Chnyen had tried this tool on GP EVM and it works without problem.
However, the tool cannot be run successfully when switching to HS-FS EVM and customer board because SMS_CM4_0_TIFS_0 cannot be connected no matter with option 1, SBL or option 2, UART boot you list in tool document.
Is there any step missing or I wonder whether we ever made this work on HS-FS EVM?
BR, Rich
Greetings Rich,
The tool can be run successfully on an HS-FS or even an HS-SE device, we've also tested it on both EVMs and customer boards across AM64x, AM62x, AM62A, etc. Several customers that have already been developing code have been able to load the tool without any issues, I think the gap here is for customers that are not deep into their development and are unfamiliar with HS-FS/GP devices or the various ways (Linux, MCU+SDK, baremetal JTAG) to get code onto the device. The readme is a basic guide of how to load the tool but is not an all-inclusive list of how to load it; this has been noted before and we are working on more detailed example documentation.
because SMS_CM4_0_TIFS_0 cannot be connected no matter with option 1, SBL or option 2, UART boot you list in tool document.
Connecting to the TIFS is not a hard requirement to load the tool. If you are using UART boot, there is no JTAG step as the SBL takes care of loading and configuring in UART boot. The only hard requirement for the tool is that power+clocks and DDR must be configured before running. CCS Gels, SDK SBL, U-boot+Linux are all different ways of achieving this goal, but individually none of them are hard requirements for the tool to run.
For Chunyen's case, it is a matter of finding the right way to perform UART boot on a GP AM62-SK board; the SDK team can help her.
For your case, you stated you have an HS-FS AM62A EVM, you use Linux, and that you have JTAG access to your board. Perhaps a simpler option then would be to leverage U-boot and Linux to perform the device configuration, after which you can load the code over JTAG. Customers that preferred to use Linux have been able to load the tool to their boards (both GP, HS-FS, or an HS-SE with JTAG unlocked) by doing:
1) Wait until Linux finishes booting, then shut it down. All you need from Linux (or even just U-boot) is the power/clock configuration and DDR configuration. Nothing else can be running for the tool to function correctly, so you need to turn Linux off completely; to shutdown Linux enter "shutdown -h now" in the terminal, then wait for the power down to complete. There is now no need to run GELs.
2) Connect over JTAG to an A53 core. Before loading the code, connect to an A53 and then hit the "CPU Reset (HW)" button, screenshot below. This will ensure the individual core is in a fresh state and not already configured from Linux (the firmware will configure the core from a fresh state). Then you can load the code to the A53 that was reset.
Sincerely,
Lucas
Hi Lucas:
I have successfully run the Margin Tool on our product. I have some questions about the PDF report generated by the Margin Tool:
1.Can the position of the blue arrow points be said to represent the DDR parameters (Vref, Delay) that we set during the Uboot phase? Then does the
Margin Tool dynamically adjust Vref and Delay based on the Uboot settings for testing?
2. Are the upper and lower limits for Vref and Delay fixed in the Margin Tool, or do they change for each test? (As shown in the image)
3. Based on (2), if the test range is fixed, would using suboptimal DDR parameters cause the blue point to shift in a certain direction? (As shown in the image)
4. I don't fully understand the difference between "Training point for rise edge rank 0" and "Training point for fall edge rank 0". Why do some blue arrows
slightly diverge? Is this caused by my firmware settings?
Greetings Chunyen,
1. The blue triangles are the read VREF and read delay parameters arrived at by the hardware training sequence, they are not set by U-boot. The margin tool will sweep a range of settings that is not limited or affected by the training values.
2. The read VREF and read delay range tested by the margin tool is fixed, if I understand your point correctly.
3. The blue triangles can be affected by DDR parameters, but it also affected by PVT (process, voltage, temperature). Each board will have slightly different processor and memory silicon, causing variation. The operating conditions of voltage and temperature can also cause these training values to shift. As long as the blue triangles are in the passing region they are fine.
4. This is due to how the IP works. It has separate delay values for capturing data on the rising and falling edge; sometimes they can come out slightly differently out of the memory and thus need slightly different values. Some bits may have them as the same or close value, others will have them slightly apart. This is normal behavior, as long as they're in the passing region they are good values.
Sincerely,
Lucas
Hi Lucas,
As I understand, after the AM62x system powers up, the hardware will automatically complete DDR calibration and find the optimal DDR calibration
parameters for the current conditions.
Is the method the hardware uses to automatically calibrate DDR and find the optimal parameters similar to how the Margin Tool tests?
Does it adjust conditions such as Vref and Delay to find the most suitable DDR parameters for the current system?
If this is correct, can I assume that the blue arrows marked in the report generated by the Margin Tool would be very close or equal to the current
system's DDR parameters?
Sincerely,
Chunyen
Lucas,
I can use Linux .WIC image to initial DDR and A53.
After running into Linux kernel, use "shutdown -h now" will shutdown but reboot immediately.
I think this is not necessary if next step "CPU Reset (HW)" will reset A53 and clean it up as well.
Then I can load the code onto A53 that was reset as you mentioned.
Thanks for the instruction for Linux.
BR, Rich
Greetings Chunyen,
The hardware sequence has several more steps to it (and adjusts more parameters than processor VREF and internal delay) but overall yes, the hardware finds the most suitable parameters for the current system.
The blue arrows in the report are the system parameters from the hardware training, they are not a result from the eye tool itself. The report simply looks at what the hardware arrived to and then marks that location. Put another way, the blue arrows are equal to the current system's DDR parameters.
Greetings Rich,
Glad to hear it!
Sincerely,
Lucas