Tool/software:
Dear all.
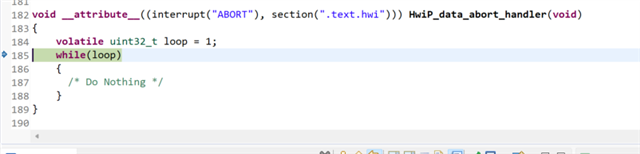
I was debugging the AM62P project and the program crashed into data_abort. Is there a way to see where it was before the exception, like call stack?
Hello Lu Shuo,
Please try the steps below to debug this exception .
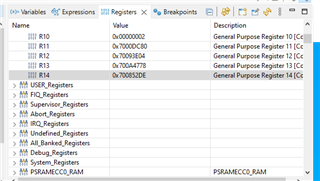
1. Keep break point in the Master's ISR
2. Note down the R14 Register
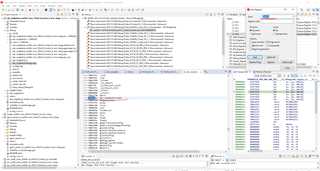
3. Search for the R14 register address in the Map file.
Here, the address might come from any line of code in the function.
So, R14 register address is not mapped to the function address.
First, we need to find the function address with the help of a map file.
For example, in my use case the R14 address does not match to any function, then I removed LSB 12 bites and searched it in the map file.
Then, this address matches exactly with the one function.
Please look at the image below .
4. Next, put the break point in the function and then see control goes from where.
Regards,
Anil.