This thread has been locked.

If you have a related question, please click the "Ask a related question" button in the top right corner. The newly created question will be automatically linked to this question.

DRA829V: How can I configure ICEPick-M router?

Part Number: DRA829V

Hi,

I am using J7 EVM target and I want to use an external JTAG probe (ARM DStream).
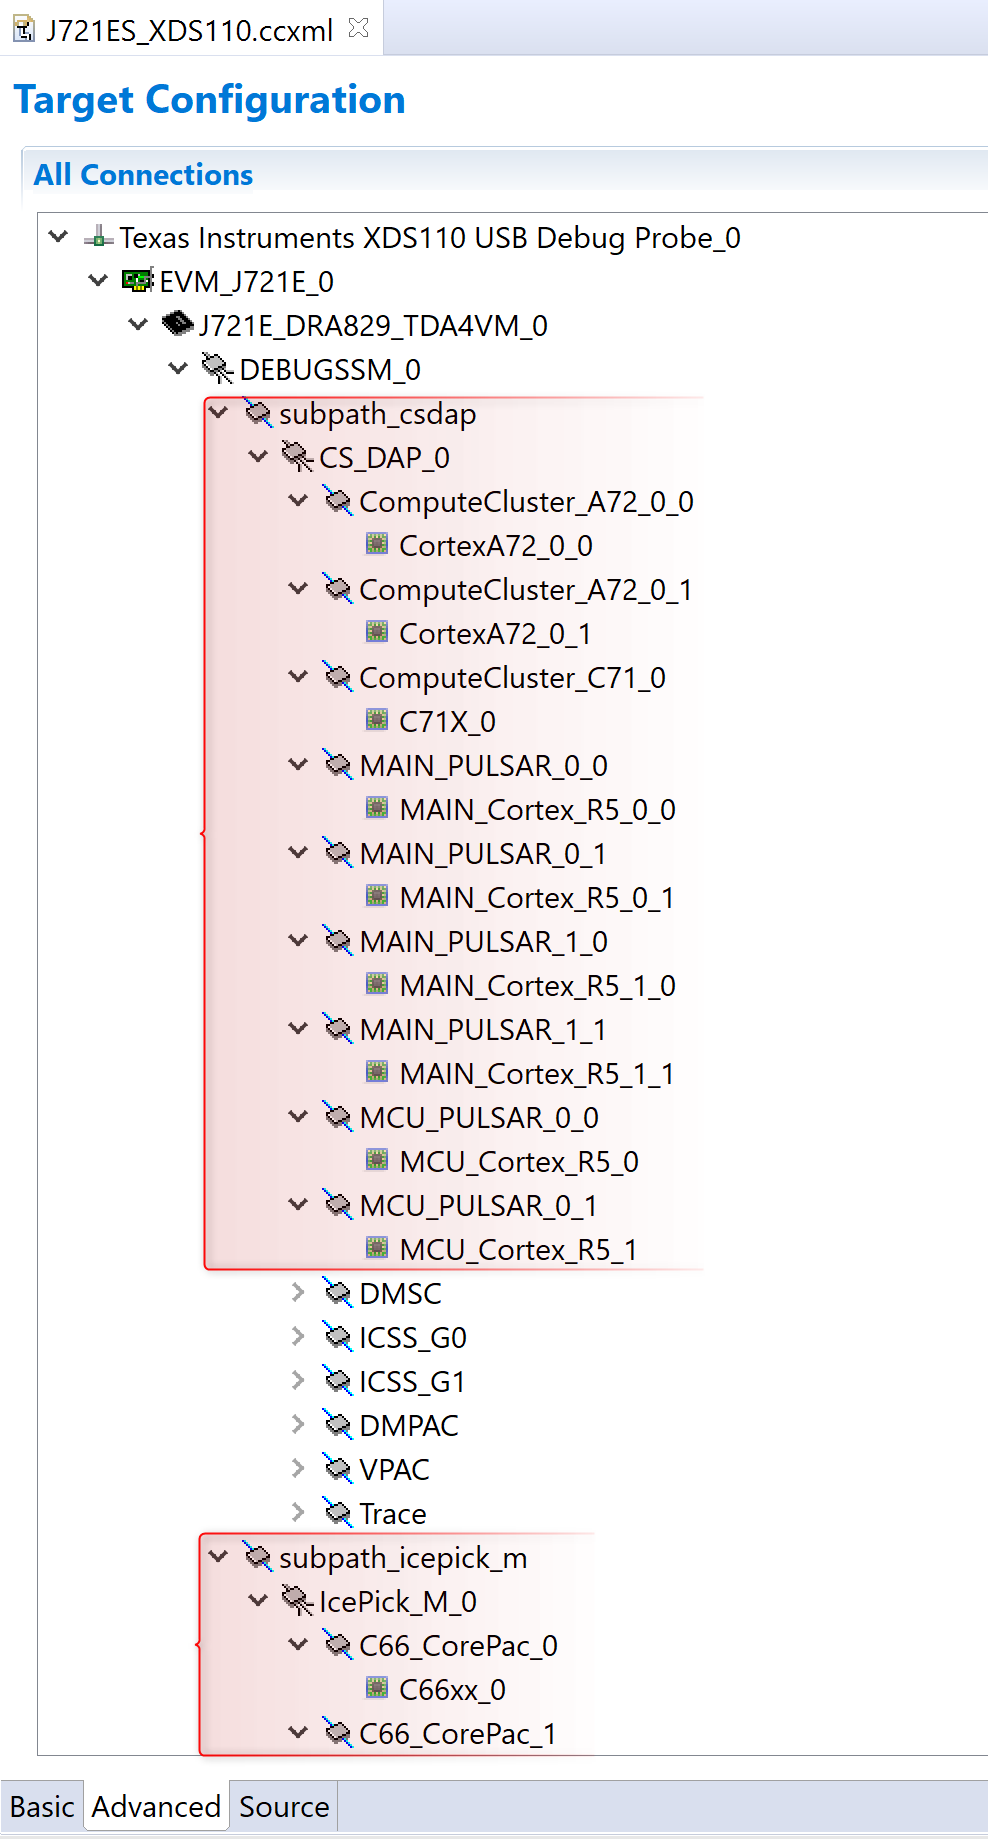
When I make a connection with the on-chip debugger XDS110, the Target Configuration in CCS suggests that my target has ICEPick-M router on it.

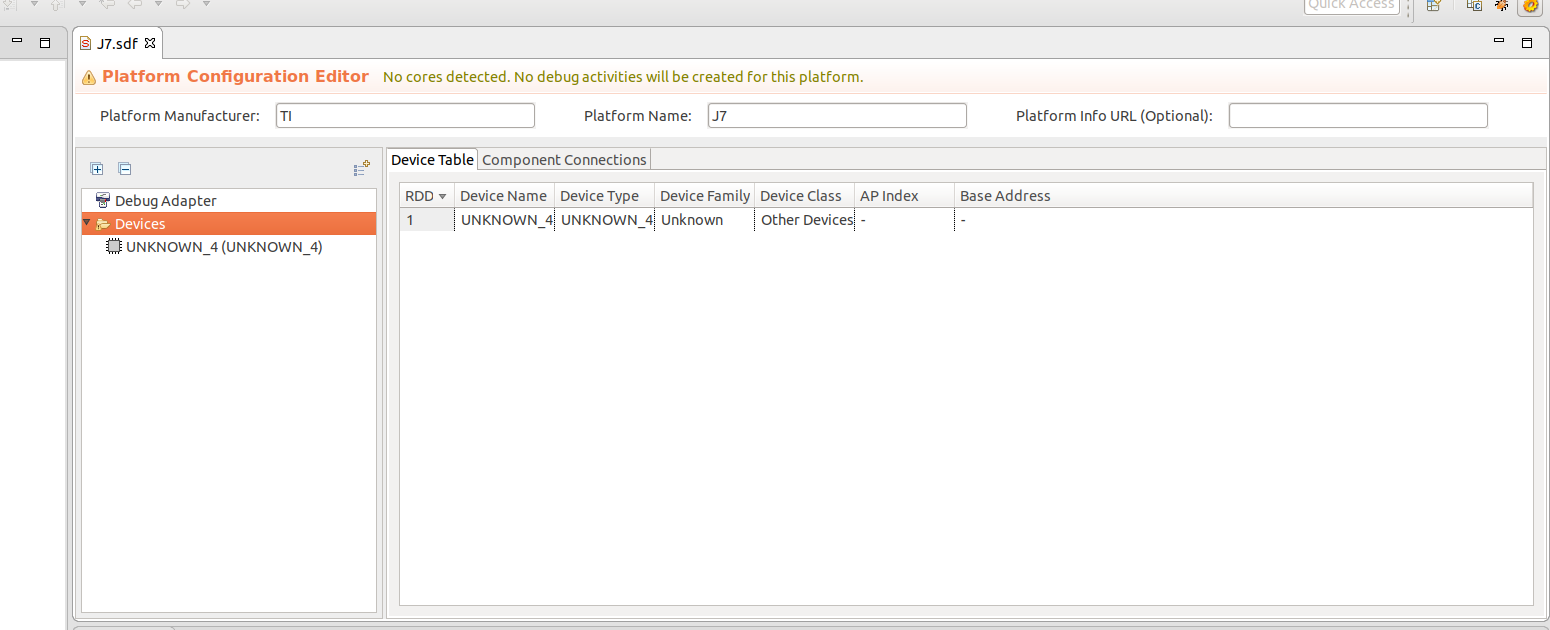
I used 'Autodetect Platform' of Arm DS-5 but did not succeed in the automatic detection of the scan-chain because I first need to program/configure the ICEPick router. There is information available about scan sequence for ICEPick-C and ICEPick-D https://processors.wiki.ti.com/index.php/ICEPICK?keyMatch=ICEPick-C&tisearch=Search-EN-Everything#What_is_ICEPick.3F but I couldn't find any information for ICEPick-M. Please provide me with the complete information for ICEPick-M.

Regards,
Iqra

  • Hello,

    Is there a specific reason you are choosing the icepick path? Generally, for this EVM and the "get started" you are probably trying to do, you should be connecting to CPU cores from the csdap path which enables all registers, gel initialization and so on. The icepick path is there for other specific cases.

    thanks,

    Alex 

  • Hi Alex,

    As I am trying to make an external JTAG probe "Arm DStream" work, I tried detecting the scan chain using Arm DS-5's Platform Configuration tool and the auto detection only showed me one device with the name UNKNOWN_4, I thought that device is ICEPick and I need to configure that in order to connect to the CPU cores.

    The summary I got is as follows:

    [15/04/20 14:33:10] JTAG Clock Speed : 7500000Hz
    [15/04/20 14:33:10] Beginning Autodetection
    [15/04/20 14:33:11] --- --- ---
    [15/04/20 14:33:11] Counting devices:
    [15/04/20 14:33:11] DR Chain [1024]:
    11111111111111111111111111111111111111111111111111111111111111111111111111111111111111111111111111111111111111111111111111111111
    11111111111111111111111111111111111111111111111111111111111111111111111111111111111111111111111111111111111111111111111111111111
    11111111111111111111111111111111111111111111111111111111111111111111111111111111111111111111111111111111111111111111111111111111
    11111111111111111111111111111111111111111111111111111111111111111111111111111111111111111111111111111111111111111111111111111111
    11111111111111111111111111111111111111111111111111111111111111111111111111111111111111111111111111111111111111111111111111111111
    11111111111111111111111111111111111111111111111111111111111111111111111111111111111111111111111111111111111111111111111111111111
    11111111111111111111111111111111111111111111111111111111111111111111111111111111111111111111111111111111111111111111111111111111
    11111111111111111111111111111111111111111111111111111111111111111111111111111111111111111111111111111111111111111111111111111110
    [15/04/20 14:33:11] Device Count: 1
    [15/04/20 14:33:11] The total IR length of the scanchain measured as 4
    [15/04/20 14:33:11] Reading IDCODEs:
    [15/04/20 14:33:11] DR Chain [32]:
    00001011101101100100000000101111
    [15/04/20 14:33:11] Device 0 has IDCODE = 0x0BB6402F (Manufacturer ID: 0x017, Part Number: 0xBB64, Revision: 0x0)
    [15/04/20 14:33:11] IR Chain [16]: 1111111111110001

    [15/04/20 14:33:11] Device 0 detected IR Length = 4
    [15/04/20 14:33:11] Device 0 detected as UNKNOWN_4
    [15/04/20 14:33:11] --- --- ---
    [15/04/20 14:33:11] Autodetection Complete

    If this device being detected is not ICEPick then what it is?
    Also, If I should connect to the cores from the csdap path and I don't need to go through icepick, how can I do that?

    Regards,
    Iqra

  • Hello Iqra, 

    I am not sure we support this 3rd party JTAG actually. I don't have it to test it myself. Are you following SDK guides to start up and connect to EVM? 

    As a starting point, you can do a quick test. Go ahead and create a new "Target Configuration File" from File->New menu, then from the drop-down list select your JTAG and select the device. You can then test the connection on the right-hand side view. Furthermore, you can start a debug session and manually connect to each core, etc. Hope it helps to get you started. Again, you can find a lot more details in the SDK guides and here on the e2e forum. 

    thanks,

    Alex

  • Hi Alex,

    I am able to use the on-chip XDS110 debugger and I can connect to EVM using it. I don't face any problem connecting to the cores using the CCS workflow.

    I need to make the 3rd party debugger work. Can you please tell if I need to connect to the processor cores using the csdap path instead of icepick path, do I still need to use that same external JTAG MIPI 60-pin connector? Is there any extra step I need to follow, anything else I need to do?

    Thank you for the support.

    Regards,
    Iqra

  • Hello Iqra, 

    I have pinged CCS team to comment further because I'm not sure how/if you can make this idea work with an external not supported debugger.

    thanks,
    Alex

  • Thanks Alex.
    Just to be clear, I don't want to use my debugger (Arm DStream) with CCS. What I want is to detect the scan chain and eventually connect with the cores using my debugger. And I need to know how can I do this using the csdap path (if going through the icepick isn't the right path).

    Regards,
    Iqra

  • I am waiting for your response, looking forward to some valuable piece of information.

    Thank you for all the support so far.

    Regards,
    Iqra

  • Hello and sorry for the delay, I was out of office for the last several days. I will send a reminder ping to experts that may be able to help. 

    thanks,

    Alex

  • Hello,

    Just as a follow up since this will be delayed a bit, we are still trying to find the best answer for you, once we have it we will reply here, so stay tuned. 

    thanks,

    Alex

  • Thank you for the cooperation.

    I am looking forward.

    Regards,
    Iqra

  • Iqra,

    First of all, please apologize for the delay; we have a release and everything got backed up. 

    Iqra Zaman1 said:
    Just to be clear, I don't want to use my debugger (Arm DStream) with CCS. What I want is to detect the scan chain and eventually connect with the cores using my debugger. And I need to know how can I do this using the csdap path (if going through the icepick isn't the right path).

    If I understood all this correctly, you intend to talk to the ICEPICK_M router and then interact with the C66x cores of your J7 device - all this with the ARM DStream Debug Probe. 

    I suspect you already realized this, but given the C66x cores are a TI proprietary core, there are no third party debugger interfaces available - in other words, there is no GDB that supports these cores. 

    At this moment we don't have a good ICEPICK_M document such as we have for a few other cores and routers, therefore at this point I am unable to provide you with the configuration information. We are trying to gather and format this information and I hope this will happen soon. 

    Regards,

    Rafael

  • Hi Rafael,

    Thanks for your response.

    Yes, I wanted to program ICEPick-M router in order to reach the cores but not the C66x cores.

    I want to reach the A72 and R5 cores. As Alex mentioned, this needs to be done using the csdap path. So then I have the question, how can I connect to the A72 and R5 cores via CS DAP? Do we have any documentation regarding going through CS DAP while connecting through an external debugger?

    Regards,

    Iqra

  • Iqra, 

    Thanks for the clarification. The ICEPICK_M router only has subpaths to connect to DSPs. 

    Code Composer Studio target configuration editor shows it in a nice tree representation:

    In this case, you need to go straight from the DebugSSM to the CS_DAP to access the A72s and R5s. 

    Our CS_DAP implementation follows the ARM specification, but I am unsure about all the details required - the target configuration contains the following information:

    The subpath address is 0x1

    The DAP AP configuration address is:

    The A72 cores are mapped to ports 0 and 1, the MCU pulsar cores are 15 and 16, while the MAIN pulsar cores are 18 through 21. You will also have to connect and release these cores from reset from the DMSC Cortex M3 core at port 17. 

    From CCS, the DebugSS, the CS_DAP and the DMSC initialization are performed by GEL scripts at the time the device is connected. This information is available on the CCS latest version install (for the most up-to-date settings).  

    I suspect there may be an OpenOCD configuration on the ether, but I couldn't yet locate it. This configuration would contain additional details such as exact register access configurations from the JTAG connection. 

    Regards,

    Rafael