This thread has been locked.

If you have a related question, please click the "Ask a related question" button in the top right corner. The newly created question will be automatically linked to this question.

CODECOMPOSER: Extremely Slow Debug Speed

Part Number: CODECOMPOSER
Other Parts Discussed in Thread: MSP430F2274-EP

Hello,

I am attempted to debug an MSP430F2274-EP on a custom CCA. Previously, I have debugged this CCA without issue, but now when I try to run the debugger the program executes as if MCLK is like 1.8 kHz. So, rather than reaching my main function in seconds, it will take minutes. I am debugging over SBW, which I know is a slower interface, but I know it shouldn't be this slow. I found a thread (pasted below) that describes the same behavior I am seeing, but a solution was never proposed; the person there had to revert to CCS V9. Is that still the case 3 years later?

e2e.ti.com/.../ccs-msp430i2041-slow-debug-speed-over-sbw

  • Update: I found other threads that appear to also be encountering this issue:

    e2e.ti.com/.../msp430f5529-ccs-debug-window-slowing-micrcontroller-clock

    e2e.ti.com/.../ccs-msp430g2553-clock-speed-is-different-when-debugging

    The second link is especially interesting. They were able to locate the cause of the slowdown: in the debug view, the clock that counts CPU cycles was enabled. Disabling the clock solved their issue.

    I tried disabling the clock on my debug view and that solved my issue as well. I'm back to running at normal speed. But this is a bug TI should investigate. Why does displaying the CPU cycle count cause the program to execute excruciatingly slow?

  • Hello Adevries,

    I am sending your thread over to the MSU430 team. Please ping the thread if you do not get a response within a couple of days.

    Regards,

    Nick

  • Hello Adevries,

    Unfortunately, this is not a bug with CCS, but just an inherent property of the debug system implemented on MSP430 devices as it is very intrusive. 

  • Hi Jace,

    Thanks for the reply. I have used the CPU cycle counter many times when debugging firmware, and have never encountered this behavior before. Why does something like counting CPU cycles cause a ~500x slowdown? And why would this issue not happen consistently? Is it because I'm using a 2000 series MSP430? Because I'm using spy bi wire instead of JTAG? Some other reason?

  • Hello adevries,

    I wouldn't be able to pinpoint it to you as there are several factors that can make debug slower. SBW over JAG connection is certainly one factor as SBW is just time spliced JTAG, so inherently much slower. The debugging tool you utilize has limits on how fast it can do JTAG/SBW connections, and a particularly noisy/ capacitive SBW connection would need to reduce speed as well. The amount of debug traffic on those lines could play a factor, which is why turning off CPU clock cycle count can speed things up. Since debugging is intrusive, it slows the CPU clock down. I've always guesstimate an effective clock frequency of 1MHz regardless of frequency set, but results may vary. Also because of the intrusive nature, everything in the device has a chance to sync up over a long period of time (relative to  MCU), so if you have a lot of interrupts enabled for example, then they will all be stacked on top of each, ready to execute, which could lead you to not getting back to your main loop. You may also run into race conditions within the code that would not be present if debug is not active.You can limit this effect by doing Free Run mode instead to a breakpoint. 

  • Hi Jace,

    That all makes total sense, but in my setup, the only variable that changes is whether CPU clock cycle count is enabled, everything else is held constant.

    I've always guesstimate an effective clock frequency of 1MHz regardless of frequency set, but results may vary.

    Yeah, that seems like a pretty fair guesstimate. Which is why I was so confused when my code was running so slowly. In fact, I just remeasured the speed and it's far worse than 2 kHz. With the CPU cycle visible, I can run the code for 15 seconds, pause it, and only 717 CPU cycles have passed, and it hasn't even reached the main function yet. So it's running at 48 Hz. With the CPU cycle disabled, I pause it immediately after starting and it's already in main().

    I don't understand how enabling CPU cycle count causes such a drastic difference in speed. Does reporting CPU cycles cause 20,000 times more debug traffic?

  • Hello,

    I could certainly see that being the case due to the relative time scales here. SBW transactions take a long time when compared to clock cycle time of the device, and the device is potentially halted between messages, depending if you are messing with breakpoints or not . Reducing SBW traffic should help with that.

    You could also use breakpoints with Free Run mode to skip past a particular time consuming part or to only debug during parts of your program you care about. Or for situations where you need to debug partial communication packets of other timing critical aspects, I recommend not engaging the debugger and use "GPIO debugging" to figure out what's going on in your code. 

  • Hi Jace,

    I compared the SBW traffic with and without the CPU clock cycle shown, and I saw about 24x as much traffic when showing the CPU cycle. That's crazy.

    Alright, I guess I'm convinced: showing CPU Cycles dramatically increases SBW traffic, and if you're SBW already runs slow, it will make things dramatically slower.

    I have two follow-up questions about this:

    1. How is SBW communication speed determined? Is it negotiated each time the debugger tries to communicate with an MCU? Is it a setting in code composer studio? Something else?

    2. Besides showing CPU cycles, are there any other debug features that can dramatically increase SBW traffic? Something like having the memory browser open shouldn't affect the average execution time, since that isn't constantly updated, it's only updated when the program is paused, right?

  • Hello,

    SBW speed as standard speeds that can be selected within CCS, but is auto-negotiated if not specified by the attached debugger. 

    I cannot provide a comprehensive list, but any advanced debug features will increase traffic. 

  • Why does something like counting CPU cycles cause a ~500x slowdown?

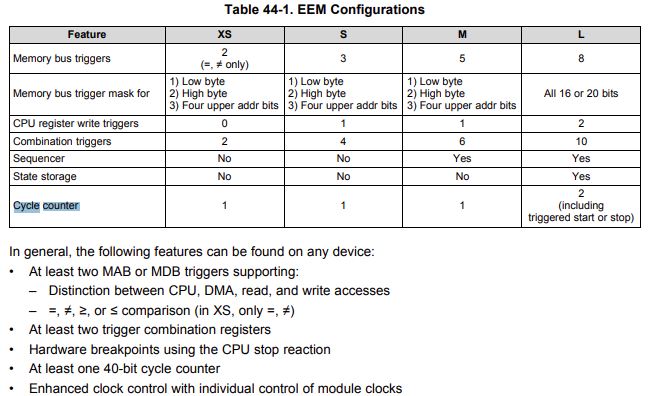
    My understanding is that for MSP430 devices there are two options for counting CPU cycles.

    1. Using the Cycle Counter in the Embedded Emulation Module (EEM) within the target device, which allows CPU cycles to be counted by the MSP430 when it runs full-speed between breakpoints. E.g. the EEM Configurations section of MSP430x5xx and MSP430x6xx Family User's Guide (Rev. Q) shows the MSP430x5xx and MSP430x6xx Family contain a cycle counter:

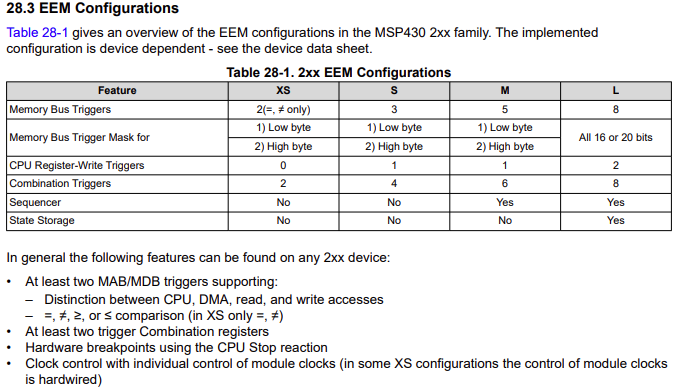
    2. If the EEM doesn't contain a Cycle Counter, then the debugger has to count CPU cycles by single-stepping the MSP430 one instruction-at-a-time and have a lookup table to determine the cycles for each instruction which has been stepped. The EEM Configurations section of MSP430F2xx, MSP430G2xx Family User's Guide (Rev. K) has no mention of a Cycle counter:

    I.e. with a MSP430F2274-EP I think it is the lack of a Cycle counter in the EEM which causes the huge slow when when the CPU cycle counter is enabled.

    I have used the CPU cycle counter many times when debugging firmware, and have never encountered this behavior before.

    Which devices was that on?

  • Hi Chester,

    Thanks for the reply. That's really interesting! I've dealt with MSP430 microcontrollers for a couple of years now, but I've never really read much about the Embedded Emulation Module or learned about the actual communication that occurs during debugging. I've never really considered that smaller, less capable microcontrollers could also have less-capable debugging abilities, but that makes total sense!

    The microcontroller I've previously debugged with the CPU cycle counter was an MSP4305438A, and I was communicating with it over full 4-wire JTAG, not SBW. So while I'm sure the full-speed communication helped, my brief experiment leads me to believe the dedicated cycle-counter is probably doing most of the heavy-lifting. I guess with both of those advantages I shouldn't be surprised I never noticed a slow-down!

    Every time I post on this forum I learn something new. Thanks for the help!

  • Hi Jace,

    Okay, that's good to know. Thank you for all the assistance.