This thread has been locked.

If you have a related question, please click the "Ask a related question" button in the top right corner. The newly created question will be automatically linked to this question.

CC2640R2F: Unable to use the Connection Monitor example

Part Number: CC2640R2F
Other Parts Discussed in Thread: CC2640,

Hi,

I'm developing a keyless entry solution for vehicles, found that the connection monitor example seems like a good start. Or do you have a more complete solution for this? I mean using a smartphone to unlock the truck when the user approaches, with an app running in the background?

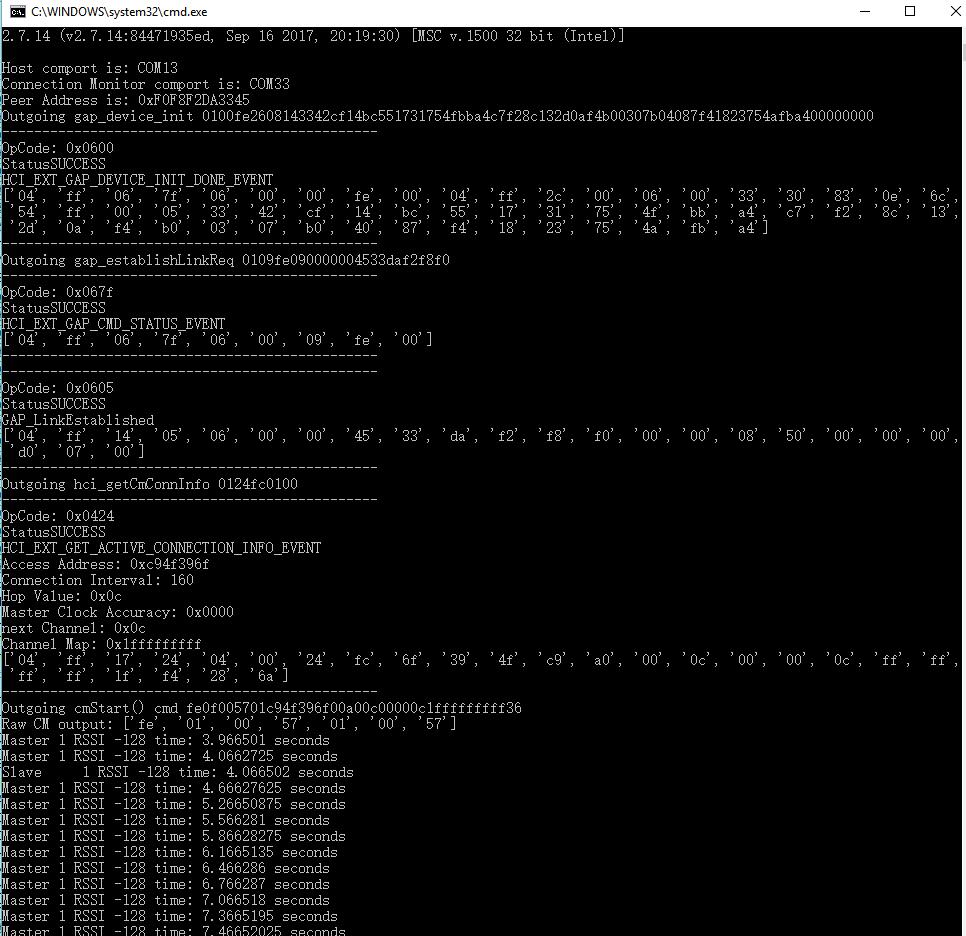
But I encountered two issues when using this example. In the end, I did not see any RSSI information comes out as expected.

Hardware & Software:

1. CC2640 Launchpad running with host_test example, SimpleLink CC2640 SDK 4.30

2. CC2640 Launchpad running with connection_monitor example, SimpleLink CC2640 SDK 4.30

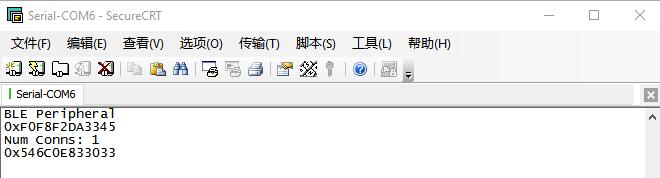
3. CC26X2 Launchpad running with simple_peripheral example, SimpleLink CC26X2 SDK 4.20....Forgive me, I only have 2 CC2640 boards, so I used a CC26X2 board instead, could this be the problem?

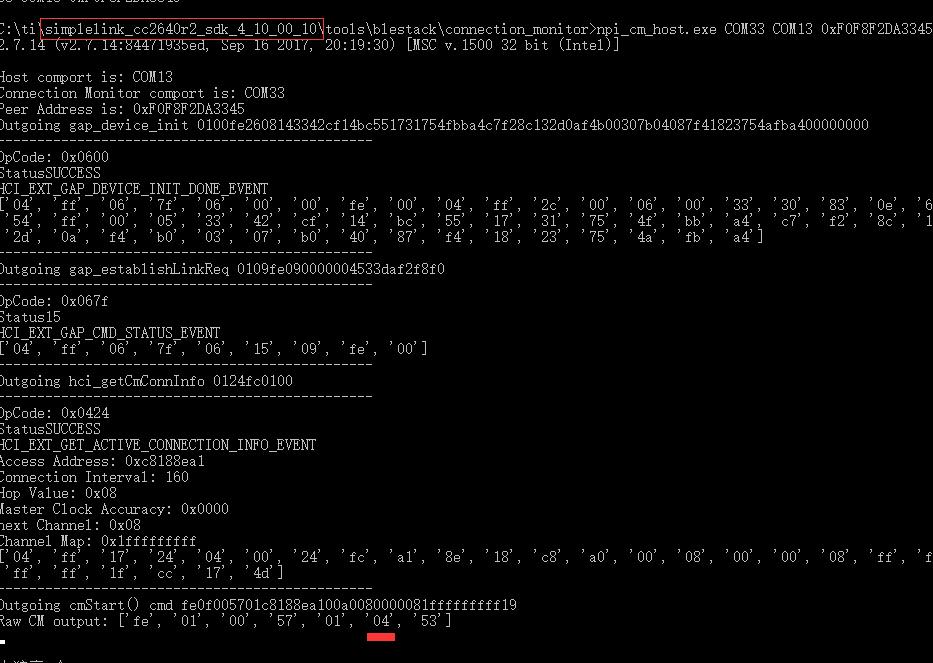
4. npi_cm_host tools for connection_monitor, SimpleLink CC2640 SDK 4.30

Issue:

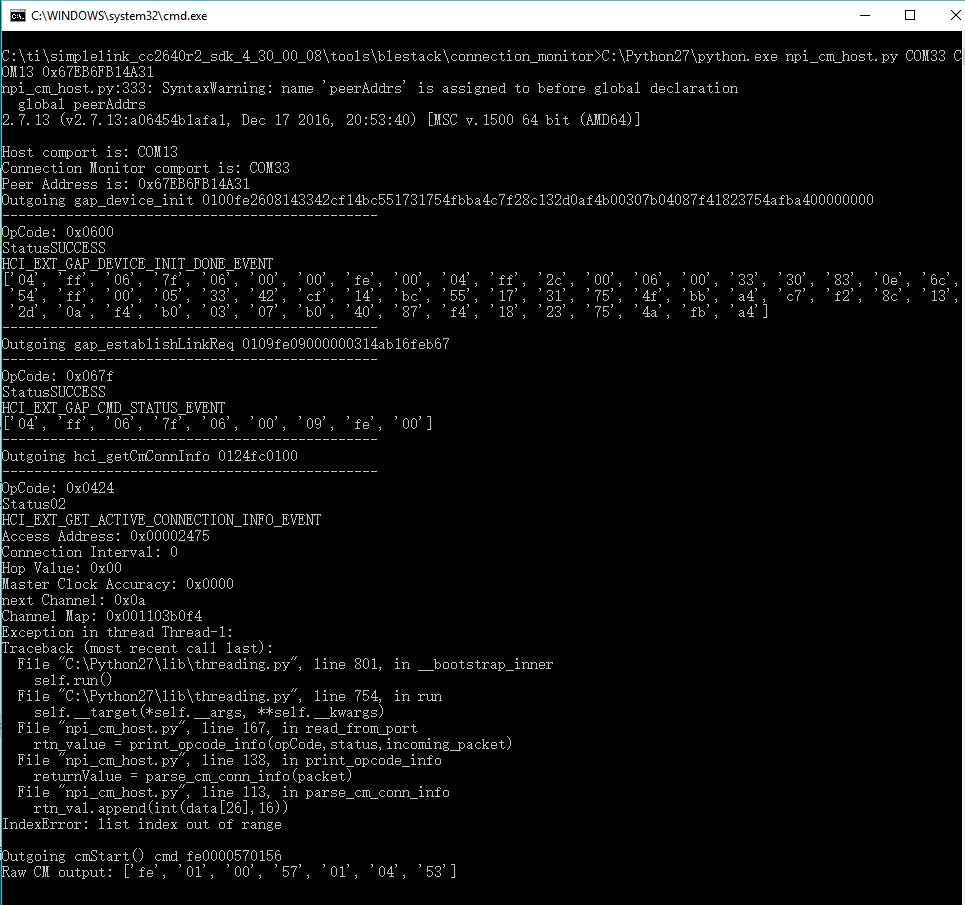
1. Python script run time index error:

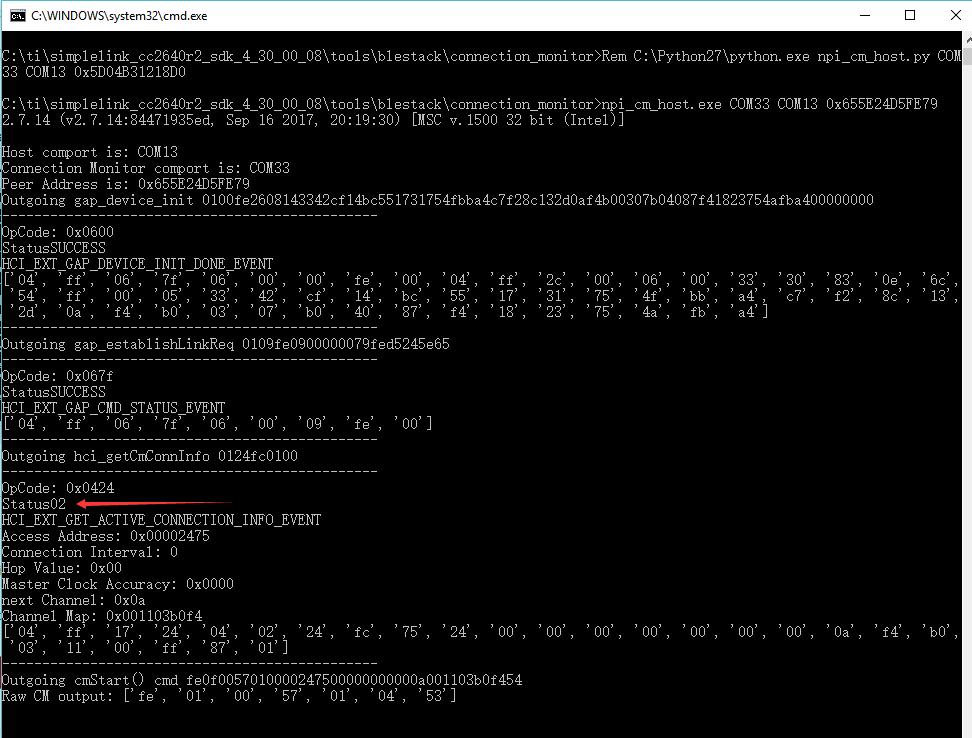
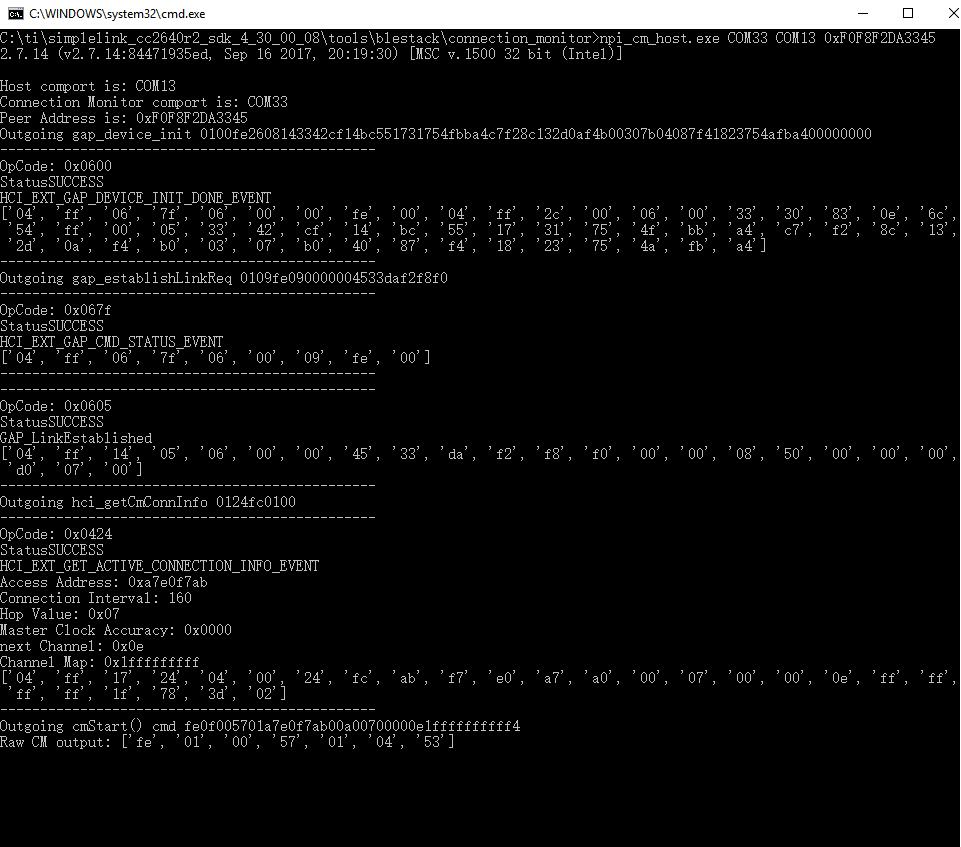
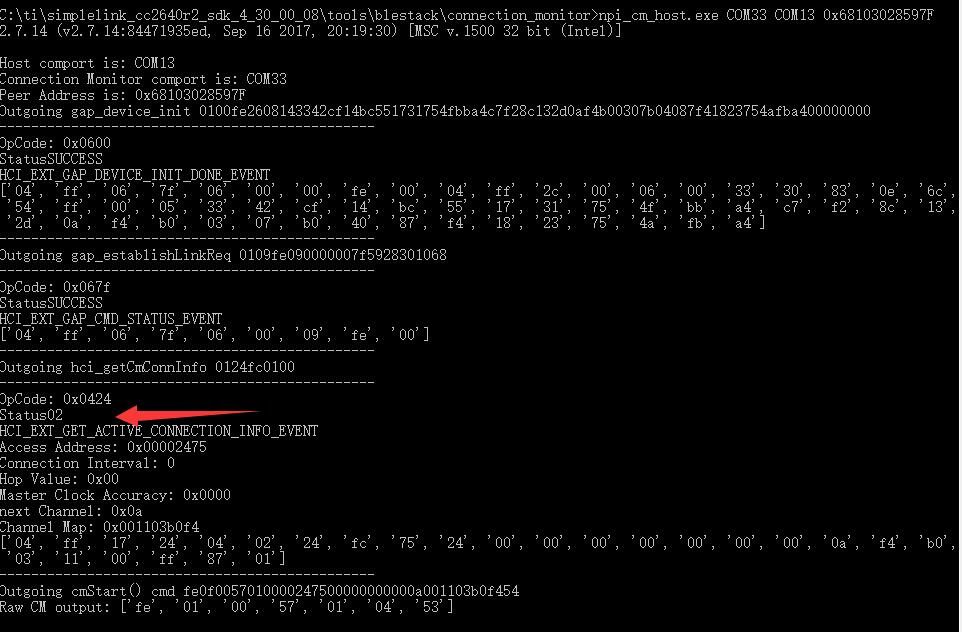
2. EXE program run time error with error code (0x02):

  • Hello Jerry,

    I have assigned an engineer to assist you with your issue.

    Best Regards,

    Jenny

  • Hi,

    The connection monitor example is only compatible with CC2640R2F devices. Could you please redo the tests with three LAUNCHXL-CC2640R2 ?

    Please refer to the README files provided with the different examples and tools you are using for additional information.

    Best regards,

  • Hi Clement,

    Thank you for your quick reply, I got three CC2640R2 Launchpads today, with the .exe utility, the test results are better than before, every step got a SUCCESS status, but in the end, I still cannot see any RSSI data and timestamps. Moreover, the python script always got an index error just like the previous test.

    Exe utility test log:

    Any thoughts?

    Best regards,

    Jerry

  • Hi Clement,

    The Raw CM output (the very last line) I got is a little different than it demonstrated in the connection_monitor/README.html, I got an error message from the CM, error code is 04, then I traced it by CCS, find something here:

    In my test, the dataLen is not 19 but 15. I did not change a single line of the examples, just out of box experience.

    Simple peripheral outputs show that there is an incoming connection:

    Best regards,

    Jerry

  • Hi Jerry,

    Glad to see you managed to solve most of the problems.

    Regarding this last problem:

    • could you confirm you are using only code and examples coming from 4.30 SDK?
    • could you provide the content of the structure pointed by pNpiMsg?
    • For testing only, could you modify the code in order to expect a command size of 15 instead of 19?
      Change if (pNpiMsg->dataLen == 19)   in    if (pNpiMsg->dataLen == 15)

    Best regards,

  • Hi Clement,

    I compared the content of the structure pointed by pNpiMsg with npi_cm_host outputs, found no difference with those fields, e.g. Access Address, Connection Interval, Hop Value, Channel Map...

    I changed if (pNpiMsg->dataLen == 19)   in    if (pNpiMsg->dataLen == 15),  and deleted a line (in the ubCM_startExt method) that uses the data with index from 15 to 18.

    ubCMConnInfo.ArrayOfConnInfo[i].crcInit = (uint32_t)((data[15]<<24) +
        (data[16]<<16) + (data[17]<<8) + data[18]);

    Finally, I got RSSI data with timestamps, but as you can see, the RSSI is constantly printed as -128:

    Best regards,

    Jerry

  • Hi Jerry,

    My message is divided in two. In the first part, I am trying to give you a quick workaround. In the second part I am trying to identify the source of the error.

    You have commented out the CRC initialization (I know you had to, just stating a fact). The problem is in function monitor_indicationCB(), if the the crc is bad then the rssi is forced to CM_RSSI_NOT_AVAILABLE (i.e. 0x7F, i.e. -128).

      /* We would like to check if the RSSI that we received is valid
       * To do this we need to first verify if the CRC on the packet was correct
       * If it is not correct then the validity of the RSSI cannot be trusted and it should be discarded
       */
      if (!rfStatus.bCrcErr)
      {
        /* CRC is good */
        rawRssi = *(pPayload + len + CM_RSSI_OFFSET);
    
        /* corrects RSSI if valid */
        rssi = CM_CHECK_LAST_RSSI( rawRssi );
      }
      else
      {
        /* CRC is bad */
        rssi = CM_RSSI_NOT_AVAILABLE;
      }

    Could you please verify if my suggestion is correct? Then the workaround should be quite straight forward :)

    That being said, I think the issue is coming from the data sent by the computer to the connection monitor (or maybe from the data received by the computer from host_test).
    I had a look to the python file (npi_cm_host.py) and it seems that a piece of it is not properly executed on your machine (at least I cannot see the print corresponding).

    Here is the content of the function parse_cm_conn_info() on my file:

    # Parse and print return values hci uart interface on host_test application
    def parse_cm_conn_info(data):
        #advance index to data start position
        rtn_val = []
    
        rtn_val.append(int(data[11],16))
        rtn_val.append(int(data[10],16))
        rtn_val.append(int(data[9],16))
        rtn_val.append(int(data[8],16))
        print "Access Address: 0x" + str(data[11]+data[10]+data[9]+data[8])
    
        rtn_val.append(int(data[13],16))
        rtn_val.append(int(data[12],16))
        print "Connection Interval: " + str(int("0x"+str(data[13]+data[12]),16))
    
        rtn_val.append(int(data[14],16))
        print "Hop Value: 0x" + str(data[14])
    
        rtn_val.append(int(data[16],16))
        rtn_val.append(int(data[15],16))
        print "Master Clock Accuracy: 0x" + str(data[16]+data[15])
    
        rtn_val.append(int(data[17],16))
        print "next Channel: 0x" + str(data[17])
    
        rtn_val.append(int(data[22],16))
        rtn_val.append(int(data[21],16))
        rtn_val.append(int(data[20],16))
        rtn_val.append(int(data[19],16))
        rtn_val.append(int(data[18],16))
        print "Channel Map: 0x" + str(data[22]+data[21]+data[20]+data[19]+data[18])
        
        rtn_val.append(int(data[26],16))
        rtn_val.append(int(data[25],16))
        rtn_val.append(int(data[24],16))
        rtn_val.append(int(data[23],16))
        print "CrcInit: 0x" + str(data[25]+data[24]+data[23])
    
        return (rtn_val)

    Could you verify if we have the same code?

    Best regards,

  • Hi Clement,

    Since I got three CC2640R2 Launch Pads, all the things related to my test were coming from CC2640R2 SimpleLink SDK 4.30 (the most up-to-date version I got from TI.com), including tools, scripts, examples...

    I confirm the python function you posted is just the same as the function I used.

    You are right, the CRC check blocked the effective RSSI data and send the CM_RSSI_NOT_AVAILABLE instead.

    Now the only issue is why that connection information is not correctly generated and transmitted, it seems that the CrcInit field of the connection information is missing.

    I really appreciate your support.

    Jerry

  • Hi Clement,

    Could it be an issue related to the CCS/compiler?

    My CCS version is: 10.1.0.00010 

    I tried two compiler version:

    1. TI v20.2.1.LTS (The results I posted above are generated by examples which use this compiler)

    2. TI v18.12.7.LTS (with this version, host_test board does not respond to any uNPI command)

    Can you tell me which versions of the CCS and compiler I should use or you are using for these examples?

    Best Regards,

    Jerry

  • Hi Jerry,

    Generally speaking, you can find the SDK dependencies inside the SDK release notes (at the root of your SDK). From what I see, for CC2640R2F SDK 4_30_00_08, here are the dependencies:

    Could you please try to use these tools versions?

    Thanks and regards,

  • Hi Clement,

    I just finished the test with the following tools:

    • TI Code Generation Tools for Arm: 18.12.1.LTS
    • TI Code Composer Studio: CCS-9.0.0.00018 
    • XDCTools: 3.51.03.28

    So far, these are the closest versions of tools that I can get. Anyway, it does not help, errors occurred just like before.

    Now, I have to use those quick workarounds to make a demo for the customer, but I'm worried about if there would be any unexpected thing happens since the CRC check is completely commented.

    Best regards,

    Jerry

  • Hi Jerry,

    With the workaround suggested you display the RSSI of all the traffic, including the traffic arriving with a bad CRC (i.e. packets that will be rejected by the device). This presents no risk in the context of a demo. We will find a better solution by the time you go to production.

    By the way, could you indicate me when you are planning to have this demo?
    Would you have time to try an older SDK (4.10 for example)? Once again the goal is to have you doing the demo, I am not suggesting you to go to production with an older SDK.

    Best regards,

  • Hi Clement,

    I tried to use the SDK 4.10, it does not work too, the last step failed with error code 04.

    Our customer demanded to get the demo no later than this week, or we will lose the chance.

    Best regards,

    Jerry

  • Hi Clement,

    As I mentioned before, we want to use the phone as a key to unlock the door, so the phone would be a BLE peripheral / advertiser (just like the simple_peripheral, right?), I tested with an android phone, but I found it's unable to get the connection information from the host_test. Is there any way to fix it?

    Best regards

    Jerry

  • Hi Jerry,

    user4392886 said:
    As I mentioned before, we want to use the phone as a key to unlock the door, so the phone would be a BLE peripheral / advertiser (just like the simple_peripheral, right?), I tested with an android phone, but I found it's unable to get the connection information from the host_test. Is there any way to fix it?

    Do you see the advertisements from the phone? Do you manage to connect to the phone? What happen when you try to get the connection information from host_test?

    Regards,

  • Hi Clement,

    The phone is advertising for sure because I can use another phone to find its advertisements, it's also connectable. The app I used on the phone named "nRF Connect".

    Here is the log of the npi_cm_host:

    Best regards,

    Jerry

  • Hi Jerry,

    The status 0x02 is supposed to say that the connection is inactive. This is a bit unexpected because the command gap_establishLinkReq is properly executed just before.

    Could you try to use BTool and the host_test board to verify if you manage to establish (and hold) a connection with the phone?

    Regards,

  • Hi Jerry,

    The conversation is going out of the initial topic (we are now having an issue with host_test / BTool). As a result I have split your thread. Let's continue the conversation about BTool and host_test here.

    Kind regards,

  • Hi again,

    Have you seen our connection monitor example for CC26X2R devices? This example is enclosed in the simplelink_cc13x2_26x2_sdk and is named "RTLS". Usually customers use it with AoA but there is also possibility to only use RSSI. Positive point, only two boards are required (slave and master).

    The example comes with a UI. The out of the box software does not allow to connect to a phone directly but it should not be much work to enable this.

    Best regards,

  • Hi Clement,

    Thank you for the suggestion, I realized maybe I can use CC2642 RTLS examples instead, but the test results show that the RTLS passive (playing the role of connection monitor, right?) has a high possibility to lose the target, then it just stops reporting RSSI information. Meanwhile, the CC2640 connection monitor never loses its target and reports RSSI information all the time.

    Best regards,

    Jerry

  • Hi Jerry,

    For CC2642, the RSSI monitoring can be done by the master device. It means you don't require the passive device.

    Regards,

  • Hi Clement,

    In our application, we want to use multiple nodes to do RSSI monitoring simultaneously, so I think I have to use the passive node, am I right?

    Best regards,

    Jerry

  • Hi Jerry,

    (For future readers, we are talking here about the RTLS_UI for CC26x2 devices)

    user4392886 said:
    In our application, we want to use multiple nodes to do RSSI monitoring simultaneously, so I think I have to use the passive node, am I right?

    '

    Correct. The RTLS UI does not accept to have more than one master. I explained in this thread the reason why the passive loses the connection - however the solution is not provided by TI.

    Best regards,

  • Hi Clement,

    Thank you so much for your help throughout the proof of concept stage of our project.

    I've read the thread in regard to why the passive loses the connection, I have a question about it:

    Can explain why the connection_monitor for CC2640 never loses the connection while the RTLS_Passive for CC2642 loses the connection frequently, is there any difference between these two examples?

    Anyway, as you advised, I can manage to "re-connect" when the passive loses the connection.

    Best regards,

    Jerry

  • Hi Jerry,

    I have asked our R&D team to look into the reasons why the connection_monitor for CC2640 never loses the connection while the RTLS_Passive for CC2642 loses the connection frequently.

    Please let me know if you have more questions or if I can close this thread.

    Best regards,

  • Hi Clement,

    Your answers helped me a lot, but the issue was not perfectly solved, if there are any other things that I can try, please let me know, if not, you may close this thread.

    Thank you & Best regards,

    Jerry