This thread has been locked.

If you have a related question, please click the "Ask a related question" button in the top right corner. The newly created question will be automatically linked to this question.

OPA2227-EP: Incoherence in open loop gain graph between simulation and datasheet

Part Number: OPA2227-EP
Other Parts Discussed in Thread: OPA2227, OPA2991, TLC2272A

Hi,

I'm contacting you regarding the measurement of open loop gain and phase using LTSPICE of OPA2227  and OPA2991. The result i have in the simulation don't totally match the datasheet results

I'm using LTspice to measure this parameter using the "big inductor/big capacitor" method given by TI the following presentation : opamps stability phase margin presentation

Here are the simulated circuit :
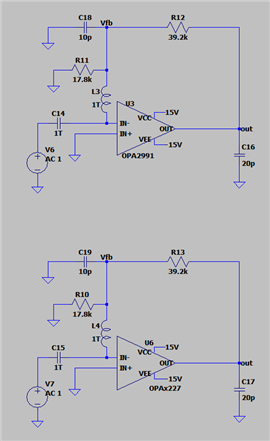
 

Simulated circuits

And here are the results of the open loop gain simulation vs the datasheet graph for the two op amp:


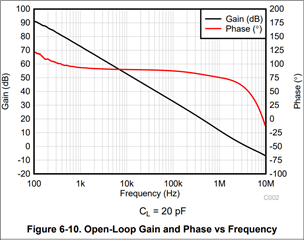
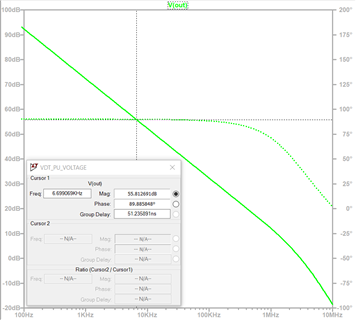
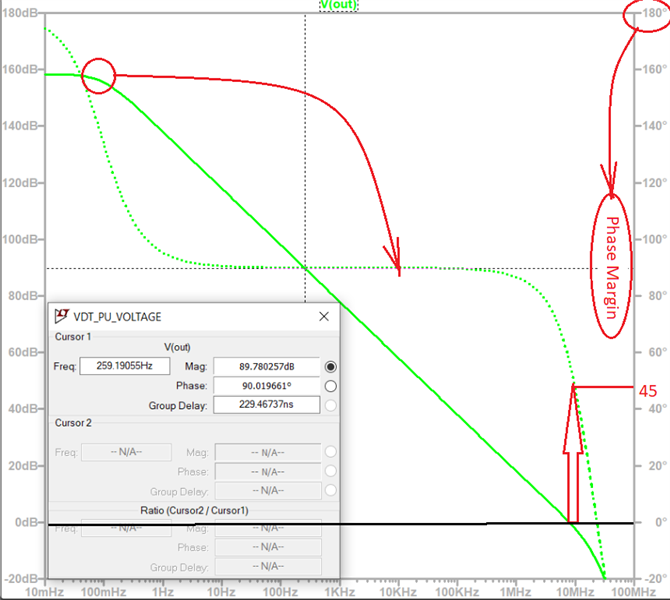
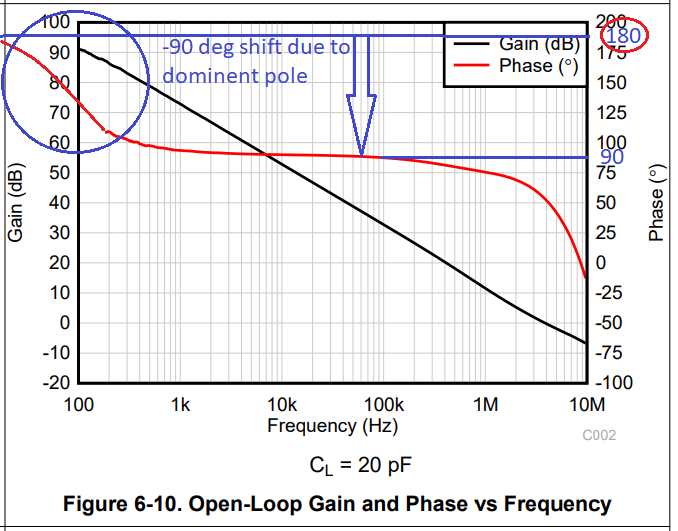
OPA2991 Open loop gain vs phase simulation and datasheet


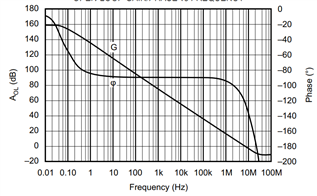
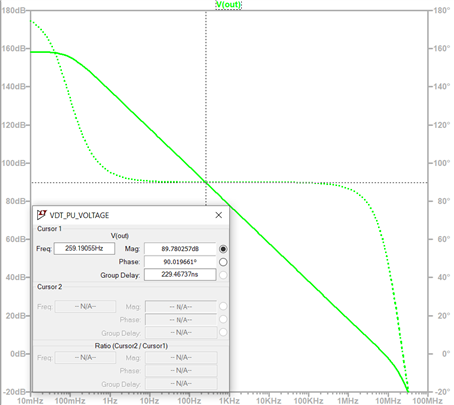
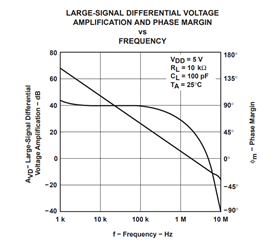
OPA2227 Open loop gain vs phase simulation and datasheet

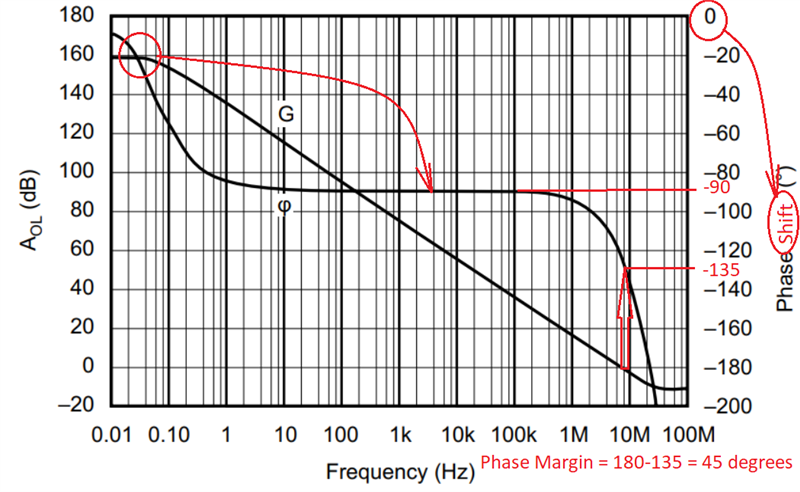
As you can see above, the two simulations results are close to the datasheet results but, in the OPA2227 case, there is a 180° shift in the phase but i think that there should be a minus sign in front of the open loop gain (represented by v(out)) to get the phase as it is given in the datasheet. This is proven by the following open loop system schematic:

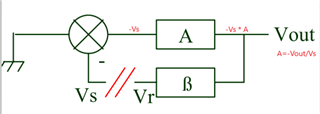
This minus sign would give the right phase for the OPA2227 but if i add this minus sign in the case of the OPA2991, it would give the wrong phase. It means that the Y axis represents the phase shift in the OPA2227 and seems to represent the phase margin in the OPA2991 datasheet...

So, i'd like to understand why there are these difference in the phase compared to the datasheet.

Thank you in advance for your response

Alassane

  • Alassane,

    The two graphs are identical and the only difference between them is that the datasheet shows Phase SHIFT while simulation shows Phase MARGIN.  Phase Margin [deg] = 180 - Phase Shift [deg]

    If the Phase at low frequency (or DC) starts at 0 degrees as shown below, it is Phase Shift - see below.

    If the Phase at low frequency (or DC) shows 180 degrees, the graph shows Phase Margin - see below. 

    Thus, if you account for Phase Margin=180-Phase Shift, in both cases for G=1 (0dB) we get Phase Margin around 45 degrees.

  • Hi Marek,

    Thanks for answering but i'm concerned more about the difference we have between the open loop curve obtained with the OPA2227 and the OPA2991, regarding the phase.

    Where is that difference coming from? Is it the phase margin or the phase shift that is respresented in the OPA2991 datasheet?

  • Hi Alassane,

    To answer your question whether the OPA2991 AOL vs frequency graph shows phase margin or phase shift, all you need to do is to check what is the phase at low frequency. Since the phase at low frequency shows 180 degrees, this means that the graph shows Phase Margin - see below.  

  • Hi Marek,

    Thank you for answering.

    How come the datasheet doesn't say directly that the Y axis correspond to the phase margin?

    For someone who is not really used to op amp, it can be very confusing and not straightforward to guess that in some datasheet the phase shift is being shown and in another one, the phase margin is being shown and in the same time, "phase margin" is clearly mentioned as in TLC2272A datasheet (TLC2272 datasheet ) : 

  • You have a good point that our system team should always label the axis properly. In the meantime, just remember that if the phase at low frequency shows zero, it must be Phase Shift and when it shows at low frequency 180 degrees, it must be Phase Margin.