This thread has been locked.

If you have a related question, please click the "Ask a related question" button in the top right corner. The newly created question will be automatically linked to this question.

OPA818: Simulating open-loop gain magnitude and phase vs frequency

Part Number: OPA818
Other Parts Discussed in Thread: OPA657

Hello,

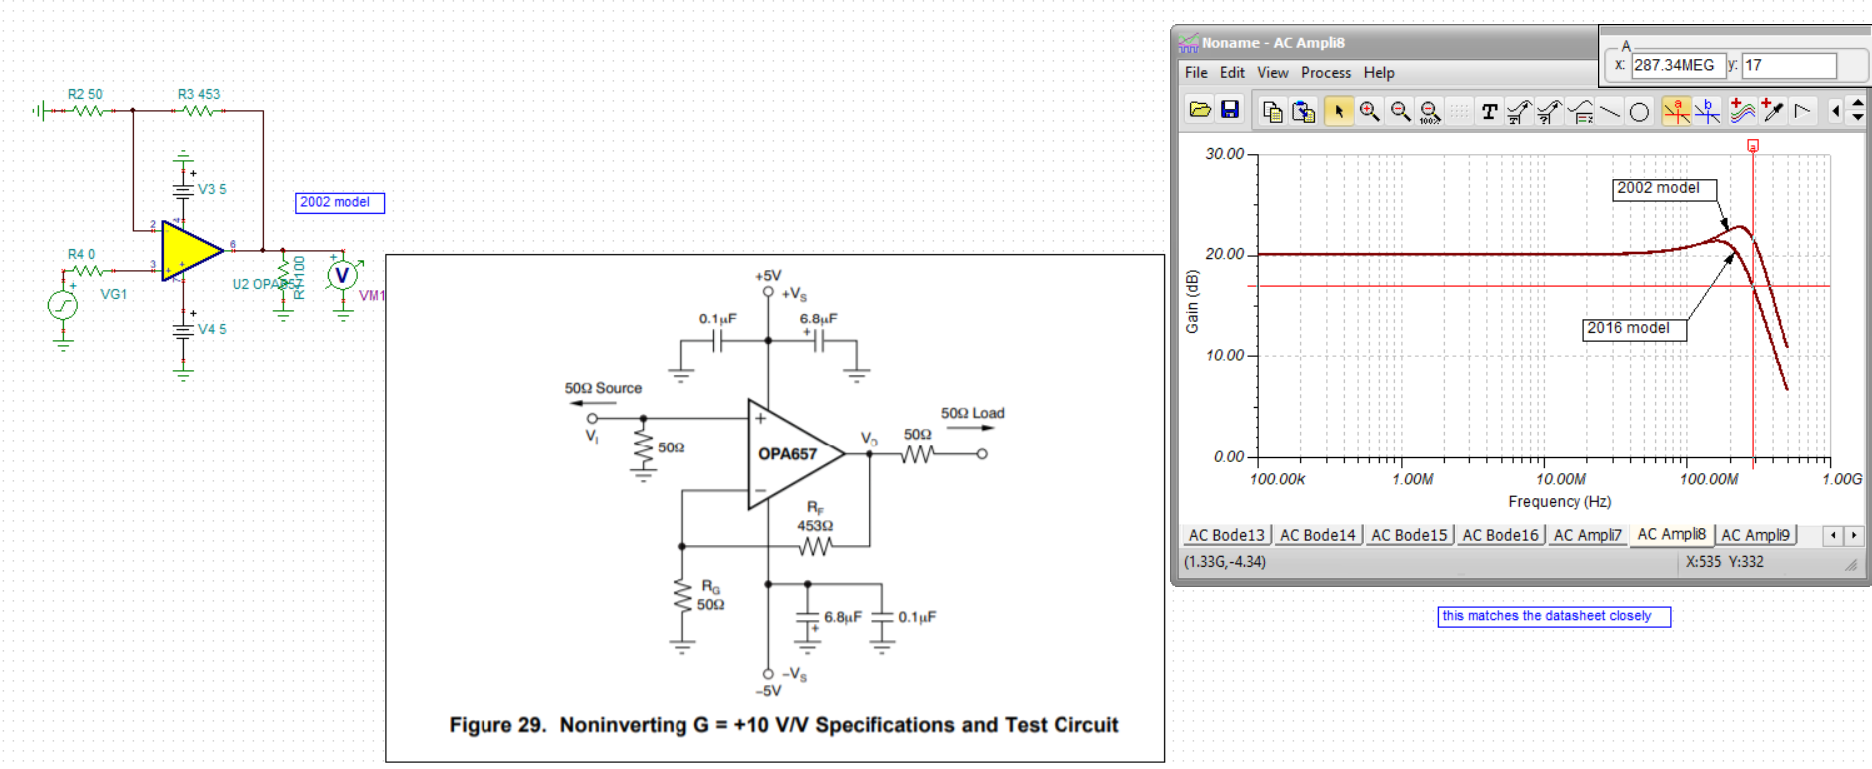
I am trying to reproduce the open-loop gain magnitude and phase vs frequency diagram shown in the datasheet. Therefore i am using TI-TINA9 and the simulation model provided by your website. However as you can see in the attached pictures neither the magnitude nor the phase plot match the datasheet. The circuit is quite simple but i guess i missed something? Could you please give me some help of how to simulate the open-loop properly?

Regards

  • Well Olaf, 

    You need to establish a DC operating point for this sim, here is how we do it, 

    Aol curve generation for VFA op amps OPA818.TSC

  • Hi,

    Thanks for the quick response. When setting the DC operating point the plot looks almost like in the datasheet. However, the phase plot shows different pole frequencies (e.g. -135deg at 410MHz in datasheet and 650MHz in the simulation). Is this to be expected?

    Regards

  • Well that does seem to be a bit off

    The datasheet says simulation, that is probably a designer full cadence sim. The TINA is a macromodel intended to match these kind of things - apparently not quite in this case. Incidentally, this OPA818 is an upgrade to the original OPA657 I worked on - if I drop that original TINA model (from V11 library) into this, it matches the data sheet plot very well - the Aol gain and phase was one of the things I always put a lot of effort into matching. Looks like the OPA818 model could use some tuning up, 

    Rea Schmid did this model back in 2002 - he worked for me and I am sure I gave him the Aol block to use. 

    Aol curve generation for VFA op amps OPA657.TSC

    This OPA657 had a 2016 update to the model, called RevC TINA reference design - it no long matches the datasheet Aol plot very closely.

    Here is that file, 

    Aol curve generation for VFA op amps OPA657 2016 update.TSC

    The 1.6GHz here does match the front page bandwidth number, but that is a gain of 40V/V calculation - the actual 40dB point on the datasheet Aol plot is over 2GHz - lining up with the original model of 2.4GHz. Little bit of an error here, I got more strict in later years about calling the GBP as the 100X40dB Aol frequency for a 1 pole rolloff intesection with 0dB. More detail on that in this article, 

    https://www.planetanalog.com/why-is-amplifier-gbp-so-confusing-insight-12/#

  • Went a little further with OPA657 model testing. 

    While the 2002 Aol curve looks like it matches Figure 16 in the datasheet closer, the closed loop gain of 10V/V in figure 1 looks to be matched better by the 2016 update, not sure what to say on this one at this point, 

    and with the 2002 model response overlayed, 

  • Hi,

    Thanks for your support. I am a bit confused about the impact of these model inaccuracies. I want to verify a transimpedance amplifier circuit based on the OPA818 to check if my feedback loop components are well dimensioned. Addtionally i need to do some signal conditioning which means that i will have mutliple amplfier stages. Do you see a problem here, e.g. can i trust the simulation based on the available models?

    Regards

  • Hi Olaf,

    can you post your schematic?

    Kai

  • Hi,

    Which schematic do you mean exactly? I have attached the basic test circuit to simulate the open loop.

    opa818_test.TSC

  • Hi Olaf,

    I would like to see the schematic of your transimpedance amplifier :-)

    Kai

  • Well Olaf, you are wondering if the model mismatch is a worry? 

    Normally, you mainly care about the loop phase margin at LG=0dB crossover. In transimpedance, that is often far below the Aol higher frequency poles and we normally focus just on the dominant pole giving the gain bandwidth product. So the Aol phase not being  a perfect match is likely not a big issue for you. 

  • Hi,

    I am still struggeling to build up a proper and stable TIA circuit. Thanks to your help i was able to do some basic simulations. However, now i want to build the transimpediance stage simulation based on a current source. The closed loop simulation still looks odd, but i am not done with the feedback path yet. When i try to simulate the open loop by setting the DC point as suggested above the simulation produces an error. How can i simulate the open loop gain with a current source like in the example attached?

    Thanks in advance

    tia_dimensioning_feedback.TSC

  • Hi Olaf,

    this way?

    olaf_opa818.TSC

    Kai

  • And the phase margin:

    olaf_opa818_1.TSC

    Kai

  • Hi,

    Thanks to your help i was able to calculate suitable values for the feedback path of my TIA (see files attached). In my phase plot (open loop) i can see a phase margin of approx. 62 degree at unity gain which is perfectly stable. However at lower frequencies (~2,3MHz) the phase margin is only 14 degrees. Does this mean the circuit is instable? A transient simulation (closed loop) with a frequency of 2,3MHz does look good and the overshoot is not extensively high, but why? The phase margin is very low at this frequency.

    Regards

    tia_open_loop.TSC

    tia_closed_loop.TSC

  • What you are interested in is actually the 1/(1+1/LG). Where the lower F phase is pushing towards 180deg that makes negative result for the 1/LG - but since the LG is very high there, it is a small negative number adding to the 1 term - no problem. up where the LG is close to 0dB (or 1) then a 180 phase around the loop will be a 1/(1-1) and it blows up - hence instabilty. 

  • Ok. So if i got that right my circuit is stable because at unity gain the phase margin is greater then 45° and even if this margin is less for lower frequencies i've got not problem there because of the limited effect to the loop gain?

    In case my assumption is right and the circuit is stable the phase of closure should be 20db/dec (or lower). I am failing to generate the appropriate graphs to verify this (based on TIPL1333 - see attachment). Could you tell me what i am doing wrong?

    Thanks in advance

    tia_rate_of_closure.TSC

  • Well that 20dB rate of closure thing is a very conservative rule of thumb, not really necessary for stability - I give a transimpedance example of nearly 40dB rate of closure with stability in the last 1/2 of this article, 

    https://www.planetanalog.com/stability-issues-for-high-speed-amplifiers-introductory-background-and-improved-analysis-insight-5/#

  • Thanks for the article. I will read it carefully and try to improve my understanding. However the image attached in my last post shows a really weird A_ol curve which cannot be true at all. So i guess that i made a simulation mistake?

    Regards

  • Hi Olaf,

    0° phase does not automatically mean instability. In this simple example 0° phase only results in instability, when it occurs at a frequency where the open loop gain equals the noise gain:

    Kai