This thread has been locked.
If you have a related question, please click the "Ask a related question" button in the top right corner. The newly created question will be automatically linked to this question.
Hi,
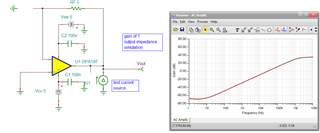
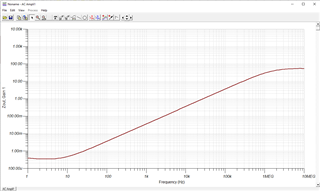
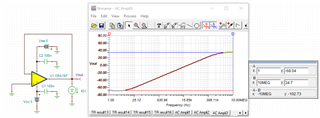
Do you have a curve showing OPA197 output impedance over frequency at closed loop gain of 1, 10 and 100?
Or a formula to calculate the closed-loop output impedance from the open-loop output impedance curve in the DS?
Thanks a lot in advance and best regards,
KF
Hi Kai,
Is there a link or guideline I can share with customer how to do it in TINA?
Thanks,
KF
Just drive a current source into the output and measure the voltage, here is gain of 1 - dBohms plot,
can't paste in snip now, that has changed since yesterday, how do I put in a picture now.
Hello KF,
Please see that attached Op amps - Trust but Verify pdf. The transformation from open-loop output impedance (Zo) to closed-loop output impedance (Zol) is covered in the slides.
Note that the OPA197 Zo is quite flat over a wide frequency range and thus, its Zol will be quite flat over frequency as well.
6740.Op_amps_Trust_but_Verify.pdf
Regards, Thomas
Precision Amplifiers Applications Engineering
I have it simulating, just can't paste the picture - the closed loop Zo is the open loop Zol divided by the 1 + LG term. It is show straight line rising 20dB/dec just like it should with the LG rolling off 20dB/dec
Hi Michael,
The image insert function works now. It had a little issue this morning.
The 2nd screen is prompted after clicking on Image/Video/file menu.
Thanks,
Raymond
It is working again to just copy from snip directly into the answer area without using Insert.
Hi Michael & Thomas/Raymond,
Thanks a lot. Let me attach the Zout curve (Gain 1) simulation with y-axis showing the impedace as ohms instead of dB.
BR,
KF
Hi KF,
It looks right. 34.7dB is 54.3Ω at 10MHz and 10^(-68.04dB/20) = 396.3μΩ at 1Hz.
I am going to close this inquiry. If you have additional questions, you are still able to open the thread.
Best,
Raymond