This thread has been locked.

If you have a related question, please click the "Ask a related question" button in the top right corner. The newly created question will be automatically linked to this question.

ADS1298: A small amount of pacing signals are connected to normal electrocardiogram data collection

Part Number: ADS1298

Dear Expert

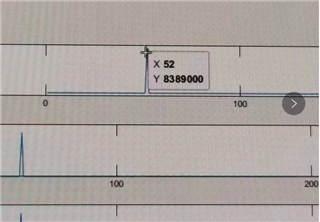
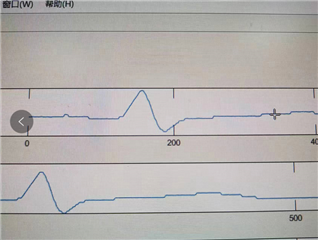
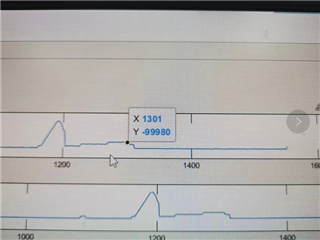
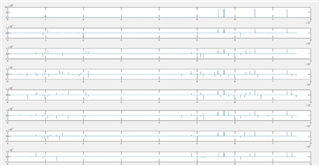
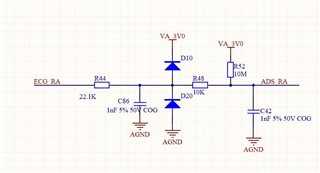
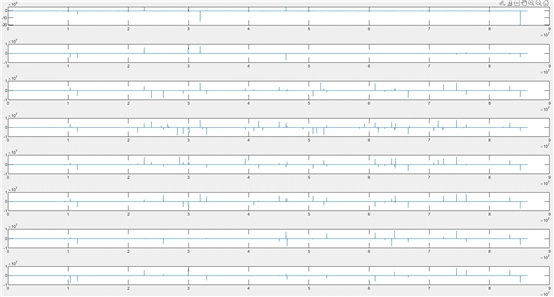
When we collected normal electrocardiogram data using ADS1298 chip design, we found a small amount of pacing signal values. For example, after collecting 10 hours of data, it is found that there may be 4-12 pacing signals in the collected electrocardiogram signals, which are randomly distributed.
The test conditions are normal sinus rhythm (adult), heart rate 60, amplitude 1mv

Below is signal generator

...

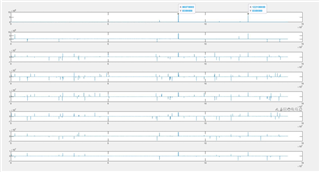
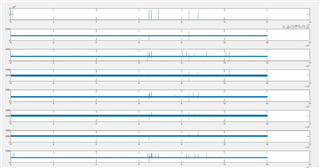
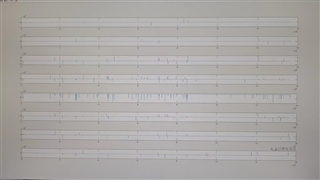
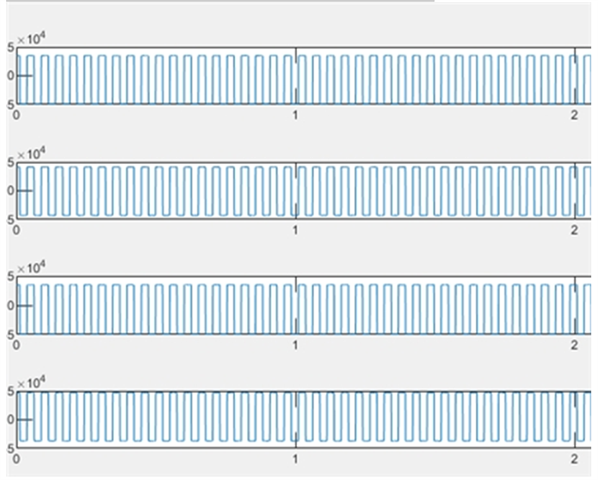
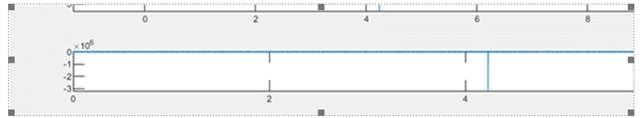
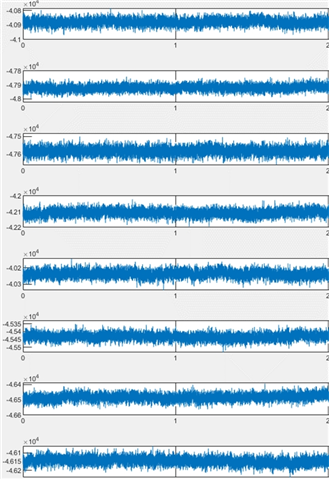
And these is the waveform

  • Hi Gabriel,

    Could you be a bit more clear what are you trying to ask? or What might be the question or issues?

    What is the signal source? Is the signal source from an ECG simulator?

    And, when you say "pacing signals"?   Were they intentionally generated?

    Or, is customer encountering/asking for some noise issue?

    if it occurs only few times in 10 hour data, maybe check and try to isolate possible noises sources from the environment, signal sources, reference voltage and power cleanness, power lines, Grounding or other components.

    e.g. see if customer could

    - use other ECG product to acquire&record from the same signal source.

    - use other signal source to repeat the same test.

    Thanks.

  • Dear Chienchun

    Use ECG signal simulator Input 1mv,60bpm ECG signal ,testing about 42 hours ,pace detection alarm 5 times.

    testing about 21 hours ,pace detection alarm 2 times.

    use another good ECG signal testing equipment , we not found any pace signal alarm. 

    Concusion: Due to pacing misjudgment when the product is equipped with ADS1298, and due to the pacing signal amplitude being greater than the normal electrocardiogram signal, the electrocardiogram signal is depicted as a straight line when using MATLAB to depict the waveform. Unable to see electrocardiogram waveform normally.
    Conclusion: The place where spikes appear simultaneously in each channel is the pacing signal. At the same time, due to the presence of pacing signals, the vertical axis threshold is raised, compressing the normal waveform into a straight line, thus forming the waveform shown in Figure 1 and Figure 2. Using other electrocardiogram instrument products to measure the electrocardiogram signals generated by the same electrocardiogram simulator, it was not found that the data contained pacing signals.

  • Hi Gabriel,

    Thanks for explanation.

    So, Could you clarify and help me understand correctly -
    No PACE signal was created/generated from the simulator, correct? 

    Or, is there any source indeed generating PACE signal?

    When you or customers mention the "pace signal",

    Do you actually mean some occasionally unpredictable small spike noises/interference?  Or, true/real PACE signal?

    in other words- 

    Do they inject PACE signal and then also observe the PACE signal?

    or

    Do they not inject any PACE signal and then observe some occasionally unpredictable small spike noises/interference?

    -----------------------------

    Can they do one more test? remove the simulator from the ADS1298. And, then try using ADS1298 do

    1. ADS1298 Internal Short Test for long hours recording.

    2. ADS1298 Internal Test Signals for long hours recording.

    hopefully, above can help isolate what might be the noises sources,

    Thanks

  • Hi,

    Since I haven't heard back from you,

    I am closing the ticket.

    Thanks

  • Dear Chien

    Sorry to update late ,customer just give us they latest mearsurment ,

    This is a graphic of the internal signal for customer testing. No pacing, but with many flying points. The test duration is about 37 hours .

    Below is customer front end circuit .

  • Hi Gabriel,

    Which TEST SIGNAL FREQUENCY did they select?

    ------------------------------

    If those plots are from the ADS1298's internal tests signals and still show random spikes, then, it could be something wrong with their PCBA and/or components on the PCBAs that cause those spikes.

    ------------------------------------------------------

    One more thing they could try is to configure the ADS to internal short test, and do the same recording to see whether the spikes exist.

    Internal short test should give reading very close to stable 0V. 

    Then,

    Could you ask them where dose their reference voltage(VREF) come from? How do they supply the reference voltage(VREF)? 

    Could they keep probing and monitoring the VREF and the power supply to the ADS? These two have to be very clean with low noises and no spikes.

    -----------------------------------------------------------

    Did they ever try keep reading the one particular register values back and without seeing any register value corruption?

    e.g. keep reading the ID register back and make sure all the read back ID register have the same value?  

    They need do make sure their SPI and data/value paring are correct.

    Thanks.

  • Dear Chien

    1.The TEST SIGNAL FREQUENCY  is set 01 ,the second choose ;

    2.Cutomer not sure , should we check their PCB layout ,below is customer's sch .

    3465.ADS1298.pdf

    3.They do internal short test ,also found some signal like pace signal .

    They use internal VREF 2.4V .

    4.It doesn't sound very feasible ,customer need mearsure about 2 hours can found these wrong signal .

  • Hi Gabriel,

    "1.The TEST SIGNAL FREQUENCY  is set 01 ,the second choose ;"

    The test signal should be square wave, but I don't see square wave. Could they focus on and zoom-in in one channel to see if there is square wave. 

    This can ensure whether they parse the data correctly.

    And, also try the DC test signal.

    ------------

    "3.They do internal short test "

    Does the signal look very close to 0?

    ------

    "They use internal VREF 2.4V "

    Ok, good to know.  Then double check the voltage/power supply source to ensure the cleanness.

    -----------------------------

    I will take a look of the schematic.

    By the way,

    How many PCBA have they built in this batch?

    And, how many ADS or PCBA do they see this issue?

    Thanks

  • Dear  Chien

    1.The DC signal has not been tested yet, as shown in the detailed square wave diagram.

    2.The test signal is mostly close to 0, but there are flying points.

    3. They tested about 14 pcs ,all of these have flying points .

  • Hi Gabriel,

    Based on the info and clues we collected -

    1. "They use internal VREF 2.4V "

    2. Internal Square wave looks clean

    3. Internal Short test signal has spikes.

    4. Waiting for the DC test signal.

    5. I checked the schematic - all the capacitors around the VCAP# and VREFP look alright

    --------------------------------------------------

    Could they do couple more tests? 

    Make sure to turn off/disable all the PACE and WCT functions.

    And, still do the internal DC and Internal short test recording again to see whether the spikes still appear?

    Try above with/from  low output data rate to mid to high and to see whether the spikes occur in any higher magnitude and/or more frequent? 

    ------------------------

    I suspect the spikes might be from either the power source or the PCB layout or both.

    ----------------------------------------------------------

    Please double check the voltage/power supply source to AVDD to ensure the cleanness -

    For example, How did they create the AVDD=VA_2V5?  I don't see how VA_2V5 is created in the schematic?

    And, VA_2V5 is shared by many other components, please make sure it could provide sufficient power and current.

    And any reason for the following design?  What is VA?

    Thanks

  • Dear Chien

    4. Waiting for the DC test signal
    The DC signal is:
    Graphics around 20 seconds:

    whole day waveform:


    Make sure to turn off/disable all the PACE and WCT functions.

    And, still do the internal DC and Internal short test recording again to see whether the spikes still appear?

    Internal DC test:

    VA is a LDO ,is 2.5V .

  • Hi Gabriel,

    appreciate for the tests results so we know the following -

    1. "They use internal VREF 2.4V "

    2. Internal Square wave looks clean

    3. Internal Short test signal has spikes.

    4. Internal DC test signal also has spikes.

    5. I checked the schematic - all the capacitors around the VCAP# and VREFP look alright

    6. VADD = 2.5V from LDO.

    -------------------------------------------

    Usually how big of those spikes when converted to voltage?

    I suspect the spikes might be from either the power source or the PCB layout or both.

    ----------------------------------------------------------

    Please double check the voltage/power supply source to AVDD to ensure the cleanness -

    And, VA_2V5 is shared by many other components, please make sure it could provide sufficient power and current for multiple components and not affected the VA_2V5 power cleanness

    And any reason for the following design?  So, is the following suggested design from LDO? If yes, do not worry. But, suggest them to monitor the cleanness of the VA and VA_2V5.

    Thanks

  • Closing this ticket as I haven't heard back from you.