This thread has been locked.

If you have a related question, please click the "Ask a related question" button in the top right corner. The newly created question will be automatically linked to this question.

AM2634-Q1: Cycle-accurate tracing for ARM ETM

Part Number: AM2634-Q1

Hello,

I am trying to use Cycle-accurate tracing feature on the ARM ETM for performance benchmarking. I am trying to figure out the number of cycles taken for each assembly instruction. It seems there was a selection switch in the past in CCS, but I did not see this switch in CCS12.1. Is there a way I can achieve this goal now with TI CCS with any TI XDS emulators? Thanks.

https://developer.arm.com/documentation/ihi0014/q/ETMv1-Signal-Protocol/Cycle-accurate-tracing

Han

  • Hello Han,

    There are a few resources that will be helpful for you. 

    The XDS Family table located here (https://software-dl.ti.com/ccs/esd/documents/xdsdebugprobes/emu_xds_target_connection_guide.html) will help to explain the different features of the XDS emulators.  The only XDS emulator capable of ARM Core Trace is the XDS Pro Trace. 

    Do you have a custom board with the AM263x that has the TI 60-pin header? This will be needed to use the XDS560V2 Pro Trace. 

    There is additional information located in the Emulation and Trace Headers TRM: https://www.ti.com/lit/ug/spru655i/spru655i.pdf

    It seems there was a selection switch in the past in CCS, but I did not see this switch in CCS12.1

    What do you mean by a selection switch? Could you share the CCS version number and screenshot of the selection switch?

    Regards,

    Erik

  • Hi Erik,

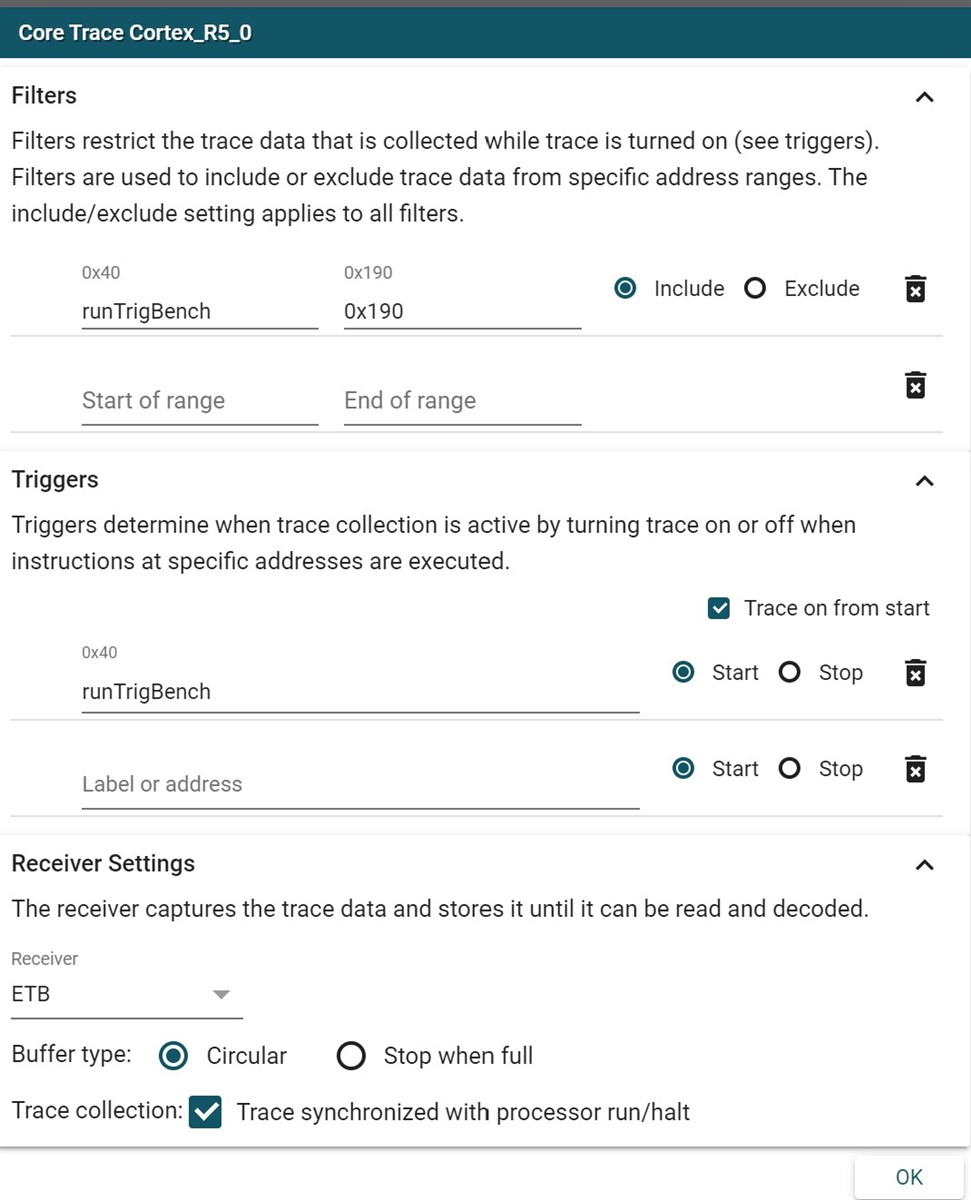
    I am using CCS version 12.2.0.00009 with XDS110 on AM2634-CC EVM. The AM263x device also supports core trace with on chip buffer with ETB on top of the pin trace feature, which is only support by the XDS560v2 Pro Trace emulator. This is the mode I am using. Please see the below setting dialog for trace on my CCS window. I have the below questions. Thanks.

    1. I am trying to get cycle accurate trace result, but the result I get here is only the sequence of instructions running though the core, but each instruction is always marked as 1 cycle (which is not the case from total number of cycles taken from my benchmark result). I believe the cycle accurate trace feature needs to be enabled by debugging tool, as specified in in the ARM ETM document as "To perform this cycle-accurate tracing, you must set bit [12] of the ETMCR to 1". I am not sure how I can achieve this with CCS.

    2. What is the Triggers setting for? I am trying to start the trace collection only when the instruction specified in the trigger address is being executed by the core, but if I do not specify filter on address, it always records from way before the code reaches the TCM address I specified as trigger and recorded a lot of OCRAM addresses (which I believe are main function before entering the benchmark core). I tried to uncheck the "trace on from start" and still does not change anything. I am not sure what the trigger setting does, and how I can achieve the goal of starting recording when trigger is hit.

    3. I understand that Pro Trace is the only probe from TI that supports pin trace, but it seems it only support a clock frequency of 6.25 MHz on the trace clock. This is really low on throughput, especially compared to the 400 MHz core and the designed trace clock of 100MHz on the SoC. Is this a true limitation, and does TI have any alternative solutions for doing pin trace?

    4. If I use a third-party trace tool that supports higher throughput pin trace, will CCS support any of them? Is there any suggestions?

    Best regards,

    Han

  • Hi Han,

    2. What is the Triggers setting for?

    Please see: 

    https://software-dl.ti.com/ccs/esd/documents/users_guide/ccs_debug-main.html#trace-visualization-toolkit

    I will need to follow up with the trace engineers for the other questions

    Thanks

    ki

  • 4. If I use a third-party trace tool that supports higher throughput pin trace, will CCS support any of them? Is there any suggestions?

    Lauterbach is popular for trace on ARM. You would use their IDE environment however (and not CCS IDE)

    https://www.lauterbach.com/frames.html?home.html

  • Ki,

    Thanks for the information. I will try to look into the Lauterbach tool and see what they have to offer. The best way is still using TI XDS tool and CCS to achieve the feature. Did you get any updates from the trace tool team on this? Thanks.

    Han

  • Did you get any updates from the trace tool team on this?

    I am waiting for feedback from the trace engineers. I will keep you posted of any updates as I receive them

  • I am still waiting for feedback. Sorry for the delay

  • 1. I am trying to get cycle accurate trace result, but the result I get here is only the sequence of instructions running though the core, but each instruction is always marked as 1 cycle (which is not the case from total number of cycles taken from my benchmark result). I believe the cycle accurate trace feature needs to be enabled by debugging tool, as specified in in the ARM ETM document as "To perform this cycle-accurate tracing, you must set bit [12] of the ETMCR to 1". I am not sure how I can achieve this with CCS.

    This is currently not supported with CCS TVT.

    3. I understand that Pro Trace is the only probe from TI that supports pin trace, but it seems it only support a clock frequency of 6.25 MHz on the trace clock. This is really low on throughput, especially compared to the 400 MHz core and the designed trace clock of 100MHz on the SoC. Is this a true limitation, and does TI have any alternative solutions for doing pin trace?

    CCS does not support pin trace for AM263. As mentioned earlier, Lauterbach may have an alternate solution worth exploring.

    Thanks

    ki