This thread has been locked.

If you have a related question, please click the "Ask a related question" button in the top right corner. The newly created question will be automatically linked to this question.

TMDSHVMTRINSPIN: Error -1142: Device blocked debug access

Part Number: TMDSHVMTRINSPIN
Other Parts Discussed in Thread: C2000WARE

Hi,

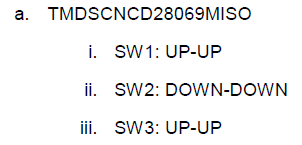
I am using kit TMDSHVMTRINSPIN with card TMDSCNCD28069MISO. I walked through the hardware configuration of both the board and card in accordance with the Instaspin motion user guide. That is, I have executed the following checks:
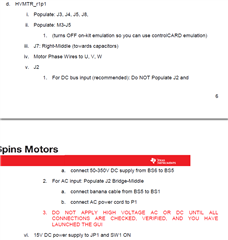
and

I am set up to use a DC power supply (not yet powered on).

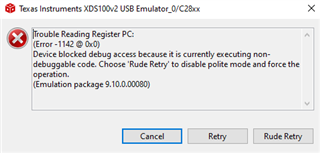
I connected up the 15VDC input power, turned on the switch, connected the control card via USB to my PC. I can see "XDS100 Class USB Serial Port" show up in Windows Device Manager. I open the Instaspin Motion GUI and it seems to begin to recognize my motor, but then pops this error:

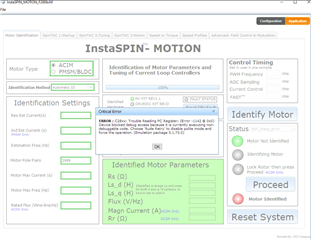
Trouble Reading Register PC: (Error -1142 @ 0x0)
Device blocked debug access because it is currently executing non-debuggable code.
Choose 'Rude Retry' to disable polite mode and force the operation.

I noticed in other forum posts that one suggestion is that this is related to the JTAG debugger losing control. I ensured M3-J5 is populated.  What else can I do to troubleshoot this issue?

Thank you,

Eileen

  • Are there any test points I can check on the M3 part of the board to ensure that is functional?

  • Hi Eileen,

    Can you see what happens if you change SW1 to wait boot mode? I believe that should be down-up, but you can double check the schematic. I think up-up is probably Flash boot, so what might be happening is that it's booting to Flash and whatever application is in Flash is putting it into a state that's blocking the connection. Wait boot should hold it in the boot ROM while you connect instead.

    Are you able to connect in CCS or do you get the same error as this GUI?

    There are some other debugger troubleshooting tips in this document: https://www.ti.com/lit/an/spracf0/spracf0.pdf

    Whitney

  • Whitney,

    Thank you very much for that advice. Where might I find a schematic that shows what the different switch configurations do?

    Additionally, to test if I can connect in CCS, is it sufficient to run Lab 1?

    I'll be able to test this out later today and will report back.

    Thank you,

    Eileen

  • In C2000Ware, there is a "boards" folder that contains schematics, user's guides, board files, etc...for all of our controlCARDs and other EVMs.

    You can definitely run the labs with CCS alone. You don't need to use the GUI. Instead you'll add the variables you want to observe to the CCS Expressions window.

    Whitney

  • Thanks Whitney.

    I tried to change the card to wait boot mode and that did not change any behavior.

    I also checked CCS - I cannot connect in CCS either:

    I am now taking a look at the debugger troubleshooting document you sent over.

  • Not sure if this helps but I also noticed this in CCS when I hit that error.The second USB emulator is disconnected/unknown.

  • So you are able to connect to the CPU and load your code at first, but the connection drops after you start running? If you use breakpoints, can you determine when it's failing? Is it always during that HAL_setupPWMs() function shown in the call stack in your screenshot?

    That lower connection is the debug connection to the CLA. The CLA isn't used by these labs, so it's okay to just leave it disconnected.

    Whitney

  • I can build the code and start debugging. Per Instaspin Lab 1, I then enter real-time clock mode in CCS and continue debugging. When I started stepping through, I noticed I would hit an error after line 620, so I set a breakpoint there. I hit the breakpoint, then try to step in. After a few seconds, that error that I sent the screenshot pops. That dialog window continues to pop up even if I hit "Cancel" from the dialog. When I hit Cancel, it changes to this view in CCS:

    The error dialog stops popping up when I hit "Rude Retry", which is when it completely fails and brings me to line 1365:

  • Are you enabling real-time mode when you start the debug session? If so and you disable it, do you still see the same error?

    Whitney