This thread has been locked.

If you have a related question, please click the "Ask a related question" button in the top right corner. The newly created question will be automatically linked to this question.

TDA4VM: CSIRX UDMA Short Packet Issue

Part Number: TDA4VM

Hi Brijesh,

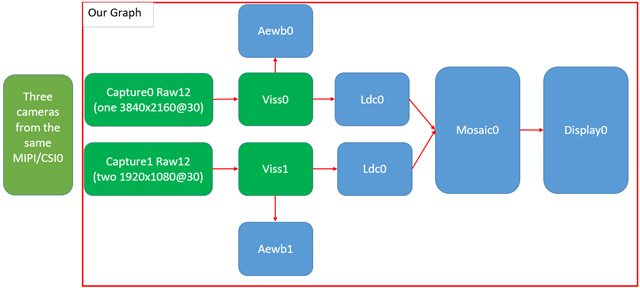
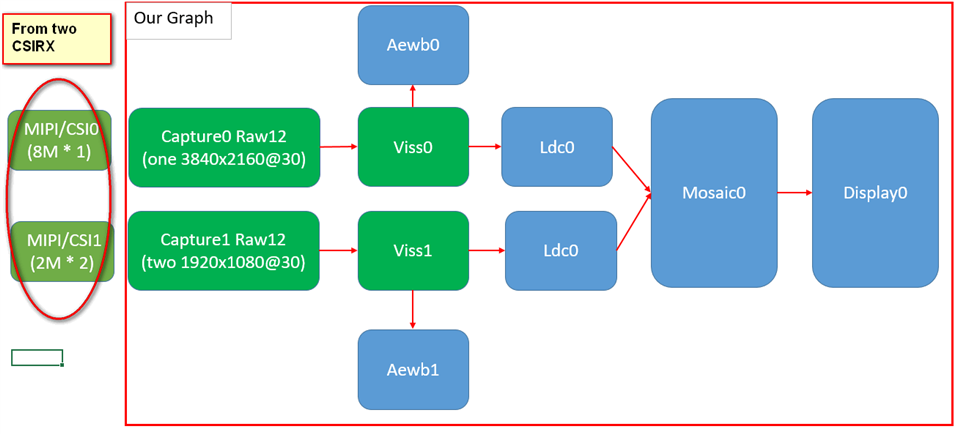
    I use one 3840 x 2160 and two 1920 x 1080 cameras and I have a samilar issue with the follow link:

 https://e2e.ti.com/support/processors-group/processors/f/processors-forum/968477/tda4vm-tda4-csirx-receiving-camera-data-problem/3594672?tisearch=e2e-sitesearch&keymatch=CSIRX#3594672

    could you send the method in that email to me ?

Regards,

Bob

  • Hi Bob,

    Do you mean you are also seeing continuous overflow? Which SDK release are you using?

    Regards,

    Brijesh

  • Hi Brijesh,

    Do you mean you are also seeing continuous overflow?

    No,but I see some short packet transfer exception in the call back function CsirxDrv_udmaCQEventCb. 

    I have done some experiments:

    1. When I remove viss node , aewb node ,msc node ,ldc node ,display node and just hold capture node  in the graph:

        It seem OK with just the first packet is NG.

    2. When use three 1920x1080 cameras with full  graph nodes:

        It is OK

    So,can you give me same sugguestion about short packet transfer exception ? DMA bandwith  issue or some else ?

    Which SDK release are you using?

    We use SKD8.2

    Regards,

    Bob

  • Hi Bob,

    The issue reported on the above link then seems different from what you are observing. 

    Are both of your camera outputting 12bit data? In this case, can you please try setting tivx_capture_inst_params_t.numPixels to value 0x2 and check again? If this is some internal BW issue, this setting should help.

    Regards,

    Brijesh 

  • Hi Brijesh,

    In this case, can you please try setting tivx_capture_inst_params_t.numPixels to value 0x2 and check again?

    I have set tivx_capture_inst_params_t.numPixels to value 0x1 which means two pixels per clock ,but short packet transfer exception still happen .

    The  tivx_capture_inst_params_t.numPixels defult value is 0x0 which means one pixel per clock.

    So,I think the real reason maybe is not there.

    Since,I just add capture node and VISS node to the graph,the Issue happen. Can VISS DMA configuraton produce this issue ?  How can I check the VISS DMA configure ? 

    Or any other sugguestion ?

    Regards,

    Bob

  • Hi Brijesh,

          Another question,What is relationship between CSIRX and VISS'DMA ?  Are they share some resources ?

    Regards,

    Bob

  • Hi Bob,

    No, both the module uses different UDMA channels, so no resource conflict. 

    Surprising, can you calculate total BW require on pen/paper and share it?

    Regards,

    Brijesh

  • Hi Brijesh,

       Since  some other components which also use DMA  in my graph,I can not give you accurate calculation .

              The follow picture is our graph,can you estimate the BW by this ?


            When I just add green nodes,the Issue happen .

            By the way,can you tell  me which register  show the reason about  short packet transfer exception ?  Or any other sugguestion ?

    Regards,

    Bob

  • Hi Bob,

    If we calculate the total BW for the green portion of the image, it would be around 2GB/s (1920x1080x2x2x2x30 + 3840x2160x2x2x30 + 1920x1080x30x1.5 + 3840x2160x30x1.5). This is not so high BW to cause any issue.. 

    What do you see in the output of the image? Are you seeing short image or some tearing image? Also do you see this issue in CSIRX output or in VISS output? 

    Also can you please share the performance statistics of this graph? I want to see if it reports any error. 

    Regards,

    Brijesh

  • Hi Brijesh,


    What do you see in the output of the image? Are you seeing short image or some tearing image?

    Yes,I  have seen the tearing image when that issue happen

    Also do you see this issue in CSIRX output or in VISS output? 

    I have seen  tearing image  in VISS output since the format of VISS output is YUV which can output to display node 

    My workmate has seen  tearing image  in CSIRX output  by filewritenode way.

    Also can you please share the performance statistics of this graph? I want to see if it reports any error.

    Regards,

    Bob

  • Hi Bob,

    ok, "Error Frame Count" does report the short/long frame errors. So either you are receiving error frames or DMA is not able to write to the buffer. 

    Are you running any other module which uses UDMA? like memory copy or PCIe or something?

    Regards,

    Brijesh

  • Hi Brijesh,

             When we use TIDL module , we also see the tearimg image and the short frame error.

             Now ,I have the follow questions:

            1. When OTF mode for CSIRX will to be supported in your sdk ?Currently is M2M mode.

             2. Why Viss node can Interference CSIRX node UDMA  operation ?

             3. Can you give more detail documents about TDA4 UDMA ?

    Regards,

    Bob

  • Hi Bob,

    Please find answers to your question.

      1. When OTF mode for CSIRX will to be supported in your sdk ?Currently is M2M mode.

    Currently, no plan to support OTF mode. 

    2. Why Viss node can Interference CSIRX node UDMA  operation ?

    I dont think so. But still want to check what all modules are active. Lets say are you doing any memory to memory copy with CSIRX + VISS? 

    3. Can you give more detail documents about TDA4 UDMA ?

    Please refer to TRM for more details on TDA4 UDMA. 

    Regards,

    Brijesh

  • Hi Brijesh,

         We use app_multi_cam as a base code with just a little change.,eg:change one capture node to two,change one viss node to two 

         Hope you give  some new ideas to  fix out  the issue !

    Regards,

    Brijesh

  • Hi Bob,

    I think VISS along should not affect CSIRX, but let me check and confirm with HW team. 

    Btw, can you please check if independently both the CSIRX instances are working fine? 

    Regards,

    Brijesh

  • Hi Brijesh,


    Btw, can you please check if independently both the CSIRX instances are working fine?

    Did you mean two capture nodes without other graph nodes ? I have check this scene,It can work fine

    Regards,

    Bob

  • No, two experiments

    1, CSIRX on inst0 + VISS

    2, CSIRX on inst1 + VISS

    regards,

    Brijesh

  • Hi Brijesh,

    I do the follow experiment,It work fine

    Regards,

    Bob

  • Hi Brijesh,

           Have you confirmed with your HW team ? Or Have any other sugguestion ?

    Regards,

    Bob

  • Hi Bob,

    Not yet complete, this is going to take some time, we are suspecting some udma issue, but let me check and confirm. 

    Regards,

    Brijesh

  • Hi Brijesh,

    Look forward to your reply !

    Regards,

    Bob

  • Hi Brijesh,


    we are suspecting some udma issue, but let me check and confirm

    Since I have no idea about this issue. What udma issue are you suspecting ? Can you share with me,I also want to check that.

    Regards,

    Bob

  • Hi Brijesh,

           Can you explain when UDMA sends end of packet signal and how UDMA detects the short packet transfer exception ? I want to know the detail  process of UDMA transfer .

    Regards,

    Bob

  • Hi Bob,

    Currently not sure exactly why this issue comes. One suspect is UDMA. Ideally, if it is not able to write fast enough (lets say if BW is not available), we should have seen overflow in the CSIRX. But your stats does not show any overflow..

    Regards,

    Brijesh 

  • Hi Brijesh,

         Since VISS node impact the CSIRX DMA transfer ,have your HW team gave some suggestion ? 

    Regards,

    Bob

  • Hi Bob,

    Not yet. i will update as soon as i get some information. 

    Regards,

    Brijesh

  • Hi Brijesh,

          I have done another experiment:

          I reduce camera FPS from 30 to 15,then it work fine. 

    Regards,

    Bob


  • Hi Brijesh,

          I have find same decription about PSI_L DMA from following picture:

                 I have some questions:

                 1. What is metadata FIFO ? Is it different from payload data path ?

                 2. If different,how the payload data  path sync with metadata FIFO entry ? May the metadata FIFO entry be getted earlier or later than payload data ?

                 3. How the receiver of PSI_L to judge short packet transfer exception ?

                 4. Can you provide the CSI PSI_L interace detail timing infomation ? 

    Regards,

    Bob

  • Hi Brijesh,

             Does TDA4 platform support 8M+2*2M cameras at one CSIRX instance  ?

            Or, does your Other Customers have the 8M+2*2M cameras at one CSIRX instance case ?

    Regards,

    Bob

  • Hi Bob,

    Does TDA4 platform support 8M+2*2M cameras at one CSIRX instance  ?

    But you are not use single CSI instance, isn't it? As per the below link, you are using 8M camera on CSI0 and 2 2M camera on CSI1, isn't it? 

    https://e2e.ti.com/support/processors-group/processors/f/processors-forum/1123874/tda4vm-csirx-udma-short-packet-issue/4170493#4170493

    Regards,

    Brijesh

  • Hi Brijesh,

    But you are not use single CSI instance, isn't it?

    No,it  isn't. We surely use three camseras(8M+2M+2M ) at single CSI instance.

    As per the below link, you are using 8M camera on CSI0 and 2 2M camera on CSI1, isn't it? 

    That link is just a experiment to verify that two CSIs is ok,but at single CSI isn't ok.

    Regards,

    Bob

  • Hi Bob,

    ok, if you use two CSI instances for capturing these 3 cameras, the issue does not come and if you have all three camera connected to single CSI instance, then you see issue? is this correct understanding? In this case, it looks like some internal issue with CSIRX. Please confirm this understanding. 

    Regards,

    Brijesh

  • Hi Brijesh,


    is this correct understanding?

    Yes ,It is

  • Hello Bob,

    Can you please try few more experiments change and see if it helps?

    EXP1: Change FIFO_LEVEL to (3840*1.5/4). FIFO_LEVEL can be set in CsirxDrv_setCslCfgParams API in the file ti-processor-sdk-rtos-j721e-evm-08_01_00_13\pdk_jacinto_08_01_00_36\packages\ti\drv\csirx\src\csirx_drv.c. Just before calling CSIRX_SetStreamCfg, you could set the value in instObj->cslObj.strmCfgParams.fifoFill variable. 

    EXP2: Change FIFO_LEVEL to (1920*1.5/4). FIFO_LEVEL can be set in CsirxDrv_setCslCfgParams API in the file ti-processor-sdk-rtos-j721e-evm-08_01_00_13\pdk_jacinto_08_01_00_36\packages\ti\drv\csirx\src\csirx_drv.c. Just before calling CSIRX_SetStreamCfg, you could set the value in instObj->cslObj.strmCfgParams.fifoFill variable. 

    EXP3: Change FIFO_MODE to 0. FIFO_MODE can be set in CsirxDrv_setCslCfgParams API in the file ti-processor-sdk-rtos-j721e-evm-08_01_00_13\pdk_jacinto_08_01_00_36\packages\ti\drv\csirx\src\csirx_drv.c. Just before calling CSIRX_SetStreamCfg, you could set the value in instObj->cslObj.strmCfgParams.fifoMode variable. 

    EXP4: Change FIFO_MODE to 2. FIFO_MODE can be set in CsirxDrv_setCslCfgParams API in the file ti-processor-sdk-rtos-j721e-evm-08_01_00_13\pdk_jacinto_08_01_00_36\packages\ti\drv\csirx\src\csirx_drv.c. Just before calling CSIRX_SetStreamCfg, you could set the value in instObj->cslObj.strmCfgParams.fifoMode variable. 

    Lets see if any of the above experiments helps to fix this issue. 

    Regards,

    Brijesh

  • Hi Brijesh,

          I have done the Experiments and get results as follow picture:


         The follow picture is result of the orignal code :


    Regards,

    Bob

  • Hi Brijesh,

       I follow the follow link and set configThroughUdmaFlag = false ,it solve the issue.

      https://e2e.ti.com/support/processors-group/processors/f/processors-forum/1058369/tda4vm-image-tearing-phenomenon-in-sdk8-0-multi-channel-camera-application/3918184#3918184

      So,can you tell me why configThroughUdmaFlag = ture of the VISS will produce the issue ? Why the config of VISS can impact CSI UDMA ?

    Regards,

    Bob

  • Hi Bob,

    That's surprising. 

    When we set this flag to true, it essentially allocates UDMA channels and uses it to save and restore VISS configuration on almost every frame. This is required because if you have different sensors, then the VISS configuration can be different for the each sensor and due to large size of the configuration, it should not be done using CPU. This is why UDMA is used to restore configuration on every frame. 

    Can you please do one more experiment? Can you please set this flag to TRUE, but use DRU channels for the capture or use DRU channels for the VISS? 

    Regards,

    Brijesh

  • Hi Brijesh,

         How to config DRU channels ? Can you give me some reference codes ?

    Regards,

    bob

  • Hi Brijesh,

        I try to config DRU channels refer  above link . When I run the app,It is blocked in function CSL_druChDisable with paremeter utcChNum equal 28. 

        MCU2_0 may not access the Register DRU_CHRT_CTL_j,can you help me to confirm that ?  Thanks !

    Regards,

    bob

  • Hi Brijesh,

             Does MCU2_0 have permisson to access Register DRU_CHRT_CTL_j ?

    Regards,

    bob

  • Hi Bob,

    Sorry for the late reply.

    Let me try it out on EVM and get back to you with the changes on SDK8.2 release.

    Regards,

    Brijesh

  • Hi Brijesh,

           Did you get some result on your EVM ? I have changed the channels of VISS to DRU,it is also be blocked .

           Is there some other parameters needed to config for DRU channel ?

    Regards,

    Brijesh

  • Hi Bob,

    Not yet, i am also seeing same issue, writing to CHRT register seems causing crash. I am checking why they are not accessible. 

    Regards,

    Brijesh

  • Hi Brijesh,

           I have checked the Register DRU_CAPABILITIES which does not support Type1 of TR.  Does CSIRX supports DRU channel type ?

          Can you confirm that ?

    Regards,

    bob

  • Hi Bob,

    That's exactly. 

    There are many differences, which is not allowing to use DRU channels for CSIRX.

    - Somehow CHRT registers not accessibe.

    - not sure what is PSIL mapping for DRU channels for CSIRX

    - driver uses TR1 type, but DRU does not support, requires driver changes..

    This has not been validated in the SDK, so will require sometime before it can be enabled. 

    Regards,

    Brijesh

  • Hi Bob,

    Can you please refer to below faq and try running CSIRX + VISS only first and see if you are still seeing short packet error? If this works, can you please try entire usecase? 

    https://e2e.ti.com/support/processors-group/processors/f/processors-forum/1130443/faq-processor-sdk-j721e-how-to-use-dru-channels-for-config-data-in-viss

    Regards,

    Brijesh

  • Hi Brijesh,

           I have done that experiment you sugguested,but there ara still short packet errors.

           I have other questions:

           1、What actually BW of VISS ?Do you think it can meet the requirement of 1*8M+5*2M cameras ?

           2、What is the different between UDMA_UTC_ID_VPAC_TC0 and UDMA_UTC_ID_VPAC_TC0 ?Can I use UDMA_UTC_ID_VPAC_TC0 ?

    Regards,

    bob

  • Hi Bob,

    Can you please help me understand what exactly experiment you did? Did you apply this patch and run the CSIRX + VISS usecase?

    If both the cameras are running at 30fps, this would require around 540MP/s VISS processing. It is bit on higher side, but this can cause fps drop. It should not cause short packet error in CSIRX. 

    - Can you please share your performance stats? 

    - Also Can you please confirm that if you run only CSIRX for all three camera, without any other nodes, it works fine? 

    Do you mean  UDMA_UTC_ID_VPAC_TC0 and UDMA_UTC_ID_VPAC_TC1? Those two are different UTD HW blocks within VPAC. We can use it, but i really doubt this will help, because error is in the CSIRX. 

    Looking at your graph again, there is a possibility that it is reaching to its limit. So can you please share the complete performance stats for your graph?

    Also can you try removing one of the node from your graph, lets say LDC, and see if it gives good result?  

    Regards,

    Brijesh

  • Hi Brijesh,


    Can you please help me understand what exactly experiment you did? Did you apply this patch and run the CSIRX + VISS usecase?

    Yes, I applyed that path ,but I also used LDC 、MSC module. I can do only CSIRX + VISS  experiment later and show you

    It is bit on higher side, but this can cause fps drop

    Yes,the frame rate is just 22 FPS. So,if we use 1*8M+5*2M cameras,how can we keep frame rate not droped

    Also Can you please confirm that if you run only CSIRX for all three camera, without any other nodes, it works fine?

    Yes ,I have confirm that .

    Do you mean  UDMA_UTC_ID_VPAC_TC0 and UDMA_UTC_ID_VPAC_TC1? Those two are different UTD HW blocks within VPAC. We can use it, but i really doubt this will help, because error is in the CSIRX.

    Yes,I mean UDMA_UTC_ID_VPAC_TC0 and UDMA_UTC_ID_VPAC_TC1. But when I try to change UDMA_UTC_ID_VPAC_TC1 to UDMA_UTC_ID_VPAC_TC0,It does not work. UDMA_UTC_ID_VPAC_TC0 is a realtime DRU block,am I right ?

    Looking at your graph again, there is a possibility that it is reaching to its limit. So can you please share the complete performance stats for your graph?

    8M_Plus_5X2M.txt
    Summary of CPU load,
    ====================
    
    CPU: mpu1_0: TOTAL LOAD =   0. 0 % ( HWI =   0. 0 %, SWI =   0. 0 % )
    CPU: mcu2_0: TOTAL LOAD =  93. 0 % ( HWI =   0. 0 %, SWI =   0. 0 % )
    CPU: mcu2_1: TOTAL LOAD =   1. 0 % ( HWI =   0. 0 %, SWI =   0. 0 % )
    CPU: mcu3_0: TOTAL LOAD =   1. 0 % ( HWI =   0. 0 %, SWI =   0. 0 % )
    CPU: mcu3_1: TOTAL LOAD =   1. 0 % ( HWI =   0. 0 %, SWI =   0. 0 % )
    CPU: C66X_1: TOTAL LOAD =   0. 0 % ( HWI =   0. 0 %, SWI =   0. 0 % )
    CPU: C66X_2: TOTAL LOAD =   0. 0 % ( HWI =   0. 0 %, SWI =   0. 0 % )
    CPU:  C7X_1: TOTAL LOAD =   0. 0 % ( HWI =   0. 0 %, SWI =   0. 0 % )
    
    
    HWA performance statistics,
    ===========================
    
    HWA:   VISS: LOAD =  73.46 % ( 415 MP/s )
    HWA:   LDC : LOAD =  84.69 % ( 369 MP/s )
    HWA:   MSC0: LOAD =  65.92 % ( 553 MP/s )
    HWA:   MSC1: LOAD =  66. 3 % ( 277 MP/s )
    
    
    DDR performance statistics,
    ===========================
    
    DDR: READ  BW: AVG =   3700 MB/s, PEAK =   6376 MB/s
    DDR: WRITE BW: AVG =   2785 MB/s, PEAK =   4399 MB/s
    DDR: TOTAL BW: AVG =   6485 MB/s, PEAK =  10775 MB/s
    
    
    Detailed CPU performance/memory statistics,
    ===========================================
    
    PERF STATS: ERROR: Invalid command (cmd = 00000003, prm_size = 388 B
    CPU: mcu2_0: TASK:           IPC_RX:   1. 0 %
    CPU: mcu2_0: TASK:       REMOTE_SRV:   0. 7 %
    CPU: mcu2_0: TASK:        LOAD_TEST:   0. 0 %
    CPU: mcu2_0: TASK:       TIVX_CPU_0:  30.37 %
    CPU: mcu2_0: TASK:          TIVX_NF:   0. 0 %
    CPU: mcu2_0: TASK:        TIVX_LDC1:   4.45 %
    CPU: mcu2_0: TASK:        TIVX_MSC1:   5.81 %
    CPU: mcu2_0: TASK:        TIVX_MSC2:   0. 0 %
    CPU: mcu2_0: TASK:       TIVX_VISS1:  31. 3 %
    CPU: mcu2_0: TASK:       TIVX_CAPT1:   0.69 %
    CPU: mcu2_0: TASK:       TIVX_CAPT2:   1.16 %
    CPU: mcu2_0: TASK:       TIVX_DISP1:   0.72 %
    CPU: mcu2_0: TASK:       TIVX_DISP2:   0. 0 %
    CPU: mcu2_0: TASK:       TIVX_CAPT3:   0.90 %
    CPU: mcu2_0: TASK:       TIVX_CAPT4:   1. 1 %
    CPU: mcu2_0: TASK:       TIVX_CAPT5:   0. 0 %
    CPU: mcu2_0: TASK:       TIVX_CAPT6:   0. 0 %
    CPU: mcu2_0: TASK:       TIVX_CAPT7:   0. 0 %
    CPU: mcu2_0: TASK:       TIVX_CAPT8:   0. 0 %
    CPU: mcu2_0: TASK:      TIVX_DISP_M:   0. 0 %
    CPU: mcu2_0: TASK:      TIVX_DISP_M:   0. 0 %
    CPU: mcu2_0: TASK:      TIVX_DISP_M:   0. 0 %
    CPU: mcu2_0: TASK:      TIVX_DISP_M:   0. 0 %
    CPU: mcu2_0: TASK:      IPC_TEST_RX:   0. 0 %
    
    CPU: mcu2_0: HEAP:   DDR_SHARED_MEM: size =   16777216 B, free =   13949440 B ( 83 % unused)
    CPU: mcu2_0: HEAP:           L3_MEM: size =     262144 B, free =     162048 B ( 61 % unused)
    
    CPU: mcu2_1: TASK:           IPC_RX:   0. 0 %
    CPU: mcu2_1: TASK:       REMOTE_SRV:   0. 4 %
    CPU: mcu2_1: TASK:        LOAD_TEST:   0. 0 %
    CPU: mcu2_1: TASK:         TIVX_SDE:   0. 0 %
    CPU: mcu2_1: TASK:         TIVX_DOF:   0. 0 %
    CPU: mcu2_1: TASK:       TIVX_CPU_1:   0. 0 %
    CPU: mcu2_1: TASK:      IPC_TEST_RX:   0. 0 %
    CPU: mcu2_1: TASK:      IPC_TEST_TX:   0. 0 %
    CPU: mcu2_1: TASK:      IPC_TEST_TX:   0. 0 %
    CPU: mcu2_1: TASK:      IPC_TEST_TX:   0. 0 %
    CPU: mcu2_1: TASK:      IPC_TEST_TX:   0. 0 %
    CPU: mcu2_1: TASK:      IPC_TEST_TX:   0. 0 %
    CPU: mcu2_1: TASK:      IPC_TEST_TX:   0. 0 %
    CPU: mcu2_1: TASK:      IPC_TEST_TX:   0. 0 %
    
    CPU: mcu2_1: HEAP:   DDR_SHARED_MEM: size =   16777216 B, free =   16773376 B ( 99 % unused)
    CPU: mcu2_1: HEAP:           L3_MEM: size =     262144 B, free =     262144 B (100 % unused)
    
    CPU: mcu3_0: TASK:           IPC_RX:   0. 0 %
    CPU: mcu3_0: TASK:       REMOTE_SRV:   0. 1 %
    CPU: mcu3_0: TASK:        LOAD_TEST:   0. 0 %
    CPU: mcu3_0: TASK:       TIVX_CPU_2:   0. 0 %
    CPU: mcu3_0: TASK:      IPC_TEST_RX:   0. 0 %
    CPU: mcu3_0: TASK:      IPC_TEST_TX:   0. 0 %
    CPU: mcu3_0: TASK:      IPC_TEST_TX:   0. 0 %
    CPU: mcu3_0: TASK:      IPC_TEST_TX:   0. 0 %
    CPU: mcu3_0: TASK:      IPC_TEST_TX:   0. 0 %
    CPU: mcu3_0: TASK:      IPC_TEST_TX:   0. 0 %
    CPU: mcu3_0: TASK:      IPC_TEST_TX:   0. 0 %
    CPU: mcu3_0: TASK:      IPC_TEST_TX:   0. 0 %
    
    CPU: mcu3_0: HEAP:   DDR_SHARED_MEM: size =    8388608 B, free =    8388352 B ( 99 % unused)
    
    CPU: mcu3_1: TASK:           IPC_RX:   0. 0 %
    CPU: mcu3_1: TASK:       REMOTE_SRV:   0. 4 %
    CPU: mcu3_1: TASK:        LOAD_TEST:   0. 0 %
    CPU: mcu3_1: TASK:       TIVX_CPU_3:   0. 0 %
    CPU: mcu3_1: TASK:      TIVX_MCANR1:   0. 0 %
    CPU: mcu3_1: TASK:      TIVX_MCANSR:   0. 0 %
    CPU: mcu3_1: TASK:      TIVX_MCANFR:   0. 0 %
    CPU: mcu3_1: TASK:      TIVX_MCANSR:   0. 0 %
    CPU: mcu3_1: TASK:      TIVX_HSMSPI:   0. 0 %
    CPU: mcu3_1: TASK:       TIVX_CSITX:   0. 0 %
    CPU: mcu3_1: TASK:      IPC_TEST_RX:   0. 0 %
    CPU: mcu3_1: TASK:      IPC_TEST_TX:   0. 0 %
    CPU: mcu3_1: TASK:      IPC_TEST_TX:   0. 0 %
    CPU: mcu3_1: TASK:      IPC_TEST_TX:   0. 0 %
    CPU: mcu3_1: TASK:      IPC_TEST_TX:   0. 0 %
    CPU: mcu3_1: TASK:      IPC_TEST_TX:   0. 0 %
    CPU: mcu3_1: TASK:      IPC_TEST_TX:   0. 0 %
    CPU: mcu3_1: TASK:      IPC_TEST_TX:   0. 0 %
    
    CPU: mcu3_1: HEAP:   DDR_SHARED_MEM: size =    8388608 B, free =    8384768 B ( 99 % unused)
    
    CPU: C66X_1: TASK:           IPC_RX:   0. 0 %
    CPU: C66X_1: TASK:       REMOTE_SRV:   0. 0 %
    CPU: C66X_1: TASK:        LOAD_TEST:   0. 0 %
    CPU: C66X_1: TASK:         TIVX_CPU:   0. 0 %
    CPU: C66X_1: TASK:      IPC_TEST_RX:   0. 0 %
    CPU: C66X_1: TASK:      IPC_TEST_TX:   0. 0 %
    CPU: C66X_1: TASK:      IPC_TEST_TX:   0. 0 %
    CPU: C66X_1: TASK:      IPC_TEST_TX:   0. 0 %
    CPU: C66X_1: TASK:      IPC_TEST_TX:   0. 0 %
    CPU: C66X_1: TASK:      IPC_TEST_TX:   0. 0 %
    CPU: C66X_1: TASK:      IPC_TEST_TX:   0. 0 %
    CPU: C66X_1: TASK:      IPC_TEST_TX:   0. 0 %
    
    CPU: C66X_1: HEAP:   DDR_SHARED_MEM: size =   16777216 B, free =   16773376 B ( 99 % unused)
    CPU: C66X_1: HEAP:           L2_MEM: size =     229376 B, free =     229376 B (100 % unused)
    CPU: C66X_1: HEAP:  DDR_SCRATCH_MEM: size =   50331648 B, free =   50331648 B (100 % unused)
    
    CPU: C66X_2: TASK:           IPC_RX:   0. 0 %
    CPU: C66X_2: TASK:       REMOTE_SRV:   0. 0 %
    CPU: C66X_2: TASK:        LOAD_TEST:   0. 0 %
    CPU: C66X_2: TASK:         TIVX_CPU:   0. 0 %
    CPU: C66X_2: TASK:      IPC_TEST_RX:   0. 0 %
    CPU: C66X_2: TASK:      IPC_TEST_TX:   0. 0 %
    CPU: C66X_2: TASK:      IPC_TEST_TX:   0. 0 %
    CPU: C66X_2: TASK:      IPC_TEST_TX:   0. 0 %
    CPU: C66X_2: TASK:      IPC_TEST_TX:   0. 0 %
    CPU: C66X_2: TASK:      IPC_TEST_TX:   0. 0 %
    CPU: C66X_2: TASK:      IPC_TEST_TX:   0. 0 %
    CPU: C66X_2: TASK:      IPC_TEST_TX:   0. 0 %
    
    CPU: C66X_2: HEAP:   DDR_SHARED_MEM: size =   16777216 B, free =   16773376 B ( 99 % unused)
    CPU: C66X_2: HEAP:           L2_MEM: size =     229376 B, free =     229376 B (100 % unused)
    CPU: C66X_2: HEAP:  DDR_SCRATCH_MEM: size =   50331648 B, free =   50331648 B (100 % unused)
    
    CPU:  C7X_1: TASK:           IPC_RX:   0. 0 %
    CPU:  C7X_1: TASK:       REMOTE_SRV:   0. 0 %
    CPU:  C7X_1: TASK:        LOAD_TEST:   0. 0 %
    CPU:  C7X_1: TASK:      TIVX_CPU_PR:   0. 0 %
    CPU:  C7X_1: TASK:      TIVX_CPU_PR:   0. 0 %
    CPU:  C7X_1: TASK:      TIVX_CPU_PR:   0. 0 %
    [MCU2_0]    115.668176 s: PHY 1: global soft-reset
    CPU:  C7X_1: TASK:      TIVX_CPU_PR:   0. 0 %
    CPU:  C7X_1: TASK:      TIVX_CPU_PR:   0. 0 %
    CPU:  C7X_1: TASK:      TIVX_CPU_PR:   0. 0 %
    CPU:  C7X_1: TASK:      TIVX_CPU_PR:   0. 0 %
    CPU:  C7X_1: TASK:      TIVX_CPU_PR:   0. 0 %
    CPU:  C7X_1: TASK:      IPC_TEST_RX:   0. 0 %
    CPU:  C7X_1: TASK:      IPC_TEST_TX:   0. 0 %
    CPU:  C7X_1: TASK:      IPC_TEST_TX:   0. 0 %
    CPU:  C7X_1: TASK:      IPC_TEST_TX:   0. 0 %
    CPU:  C7X_1: TASK:      IPC_TEST_TX:   0. 0 %
    CPU:  C7X_1: TASK:      IPC_TEST_TX:   0. 0 %
    CPU:  C7X_1: TASK:      IPC_TEST_TX:   0. 0 %
    CPU:  C7X_1: TASK:      IPC_TEST_TX:   0. 0 %
    
    CPU:  C7X_1: HEAP:   DDR_SHARED_MEM: size =  268435456 B, free =  268435200 B ( 99 % unused)
    CPU:  C7X_1: HEAP:           L3_MEM: size =    8159232 B, free =    8159232 B (100 % unused)
    CPU:  C7X_1: HEAP:           L2_MEM: size =     458752 B, free =     458752 B (100 % unused)
    CPU:  C7X_1: HEAP:           L1_MEM: size =      16384 B, free =      16384 B (100 % unused)
    CPU:  C7X_1: HEAP:  DDR_SCRATCH_MEM: size =  385875968 B, free =  385875968 B (100 % unused)
    
    
    GRAPH: app_multi_cam_graph (#nodes =  19, #executions =    227)
     NODE:       CAPTURE4:            capture_node4: avg =  84075 usecs, min/max =    120 / 18180991 usecs, #executions =        227
     NODE:     VPAC_VISS1:                viss_node: avg =  11704 usecs, min/max =  10437 /  13387 usecs, #executions =        227
     NODE:         IPU1-0:                aewb_node: avg =   5747 usecs, min/max =   2092 /  71400 usecs, #executions =        227
    [MCU2_0]    115.870707 s: EnetPhy_enableState: PHY 1: falling back to manual mode
     NODE:      VPAC_LDC1:                 ldc_node: avg =   8749 usecs, min/max =   7309 /  13765 usecs, #executions =        230
     NODE:       CAPTURE3:            capture_node3: avg =  81190 usecs, min/max =    108 / 18180760 usecs, #executions =        230
    [MCU2_0]    115.870815 s: EnetPhy_enableState: PHY 1: new link caps: FD100 
     NODE:     VPAC_VISS1:                viss_node: avg =   6129 usecs, min/max =   5171 /   6879 usecs, #executions =        230
     NODE:         IPU1-0:                aewb_node: avg =   6798 usecs, min/max =   1937 /  59983 usecs, #executions =        230
     NODE:       CAPTURE2:            capture_node2: avg =  28033 usecs, min/max =    141 / 5895990 usecs, #executions =        230
     NODE:     VPAC_VISS1:                viss_node: avg =  11738 usecs, min/max =  10113 /  12961 usecs, #executions =        230
     NODE:         IPU1-0:                aewb_node: avg =  12706 usecs, min/max =   4877 /  19973 usecs, #executions =        230
     NODE:      VPAC_LDC1:                 ldc_node: avg =  10682 usecs, min/max =   6714 /  13776 usecs, #executions =        230
     NODE:       CAPTURE1:            capture_node1: avg =  17389 usecs, min/max =     93 / 3421263 usecs, #executions =        230
     NODE:     VPAC_VISS1:                viss_node: avg =  14189 usecs, min/max =  13752 /  15430 usecs, #executions =        230
     NODE:         IPU1-0:                aewb_node: avg =   8095 usecs, min/max =   5228 /  25320 usecs, #executions =        230
     NODE:          A72-0:      viss_h3a_write_node: avg =      7 usecs, min/max =      5 /     19 usecs, #executions =        233
     NODE:      VPAC_LDC1:                 ldc_node: avg =  19173 usecs, min/max =  13961 /  21776 usecs, #executions =        233
     NODE:      VPAC_MSC1:              mosaic_node: avg =  32122 usecs, min/max =  29079 /  91550 usecs, #executions =        233
     NODE:       DISPLAY1:              DisplayNode: avg =  19419 usecs, min/max =     88 /  33787 usecs, #executions =        233
     NODE:          A72-0:      viss_img_write_node: avg =      8 usecs, min/max =      6 /     26 usecs, #executions =        233
    
     PERF:           FILEIO: avg =      0 usecs, min/max = 4294967295 /      0 usecs, #executions =          0
     PERF:            TOTAL: avg =  45086 usecs, min/max =  28893 /  59898 usecs, #executions =         85
    
     PERF:            TOTAL:   22.17 FPS
    
    [MCU2_0]    116.088276 s: ==========================================================
    [MCU2_0]    116.088402 s:  Capture Status: Instance|0
    [MCU2_0]    116.088443 s: ==========================================================
    [MCU2_0]    116.088496 s:  overflowCount: 0
    [MCU2_0]    116.088535 s:  spuriousUdmaIntrCount: 0
    [MCU2_0]    116.088572 s:  frontFIFOOvflCount: 0
    [MCU2_0]    116.088608 s:  crcCount: 0
    [MCU2_0]    116.088638 s:  eccCount: 0
    [MCU2_0]    116.088671 s:  correctedEccCount: 0
    [MCU2_0]    116.088705 s:  dataIdErrorCount: 0
    [MCU2_0]    116.088741 s:  invalidAccessCount: 0
    [MCU2_0]    116.088775 s:  invalidSpCount: 0
    [MCU2_0]    116.088815 s:  strmFIFOOvflCount[0]: 0
    [MCU2_0]    116.088847 s:  Channel Num | Frame Queue Count | Frame De-queue Count | Frame Drop Count | Error Frame Count |
    
    
     =========================
     Demo : Camera Demo
     =========================
    
    [MCU2_0]    116.088926 s:            0 |               239 |                  237 |              522 |                 0 |
     s: Save CSIx, VISS and LDC outputs
    
     t: multi_cam Save picture
    
     p: Print performance statistics
    
     f: Print camera error detection status
    [MCU2_0]    116.089259 s: ==========================================================
    
     i: Print camera internal parameters
    
     x: Exit
    [MCU2_0]    116.089355 s:  Capture Status: Instance|0
    
     Enter Choice: 
    
    
     =========================
     Demo : Camera Demo
    [MCU2_0]    116.089398 s: ==========================================================
     =========================
    
     s: Save CSIx, VISS and LDC outputs
    
    [MCU2_0]    116.089451 s:  overflowCount: 0
     t: multi_cam Save picture
    
     p: Print performance statistics
    
    [MCU2_0]    116.089491 s:  spuriousUdmaIntrCount: 0
     f: Print camera error detection status
    
     i: Print camera internal parameters
    
     x: Exit
    [MCU2_0]    116.089529 s:  frontFIFOOvflCount: 0
    
     Enter Choice: [MCU2_0]    116.089563 s:  crcCount: 0
    [MCU2_0]    116.089595 s:  eccCount: 0
    [MCU2_0]    116.089628 s:  correctedEccCount: 0
    [MCU2_0]    116.089662 s:  dataIdErrorCount: 0
    [MCU2_0]    116.089695 s:  invalidAccessCount: 0
    [MCU2_0]    116.089730 s:  invalidSpCount: 0
    [MCU2_0]    116.089811 s:  strmFIFOOvflCount[0]: 0
    [MCU2_0]    116.089858 s:  Channel Num | Frame Queue Count | Frame De-queue Count | Frame Drop Count | Error Frame Count |
    [MCU2_0]    116.089944 s:            0 |               239 |                  237 |              447 |                 6 |
    [MCU2_0]    116.090025 s:            1 |               239 |                  237 |              447 |                 3 |
    [MCU2_0]    116.090471 s: ==========================================================
    [MCU2_0]    116.090611 s:  Capture Status: Instance|1
    [MCU2_0]    116.090657 s: ==========================================================
    [MCU2_0]    116.090741 s:  overflowCount: 0
    [MCU2_0]    116.090786 s:  spuriousUdmaIntrCount: 0
    [MCU2_0]    116.090915 s:  frontFIFOOvflCount: 0
    [MCU2_0]    116.090963 s:  crcCount: 0
    [MCU2_0]    116.090996 s:  eccCount: 0
    [MCU2_0]    116.091032 s:  correctedEccCount: 0
    [MCU2_0]    116.091066 s:  dataIdErrorCount: 0
    [MCU2_0]    116.091100 s:  invalidAccessCount: 0
    [MCU2_0]    116.091134 s:  invalidSpCount: 0
    [MCU2_0]    116.091172 s:  strmFIFOOvflCount[0]: 0
    [MCU2_0]    116.091278 s:  Channel Num | Frame Queue Count | Frame De-queue Count | Frame Drop Count | Error Frame Count |
    [MCU2_0]    116.091367 s:            0 |               239 |                  237 |               80 |                 0 |
    [MCU2_0]    116.093154 s: ==========================================================
    [MCU2_0]    116.093487 s:  Capture Status: Instance|1
    [MCU2_0]    116.093534 s: ==========================================================
    [MCU2_0]    116.093585 s:  overflowCount: 0
    [MCU2_0]    116.093621 s:  spuriousUdmaIntrCount: 0
    [MCU2_0]    116.093657 s:  frontFIFOOvflCount: 0
    [MCU2_0]    116.093688 s:  crcCount: 0
    [MCU2_0]    116.093717 s:  eccCount: 0
    [MCU2_0]    116.093749 s:  correctedEccCount: 0
    [MCU2_0]    116.093782 s:  dataIdErrorCount: 0
    [MCU2_0]    116.093815 s:  invalidAccessCount: 0
    [MCU2_0]    116.093849 s:  invalidSpCount: 0
    [MCU2_0]    116.093886 s:  strmFIFOOvflCount[0]: 0
    [MCU2_0]    116.093916 s:  Channel Num | Frame Queue Count | Frame De-queue Count | Frame Drop Count | Error Frame Count |
    [MCU2_0]    116.093994 s:            0 |               238 |                  236 |               80 |               294 |
    [MCU2_0]    116.094070 s:            1 |               238 |                  236 |               80 |               157 |


    Also can you try removing one of the node from your graph, lets say LDC, and see if it gives good result?

    I have removed LDC and MSC,It still have issue.So,I think the VISS is the bottleneck.

    Regards,

    bob

  • Hi Brijesh,

          When I use 1*8M+5*2M case (CSIRX+VISS only),the load of VISS is 73.24% ( 414MP/s )  and frame rate is just 22 FPS. 

          1、Can you give me some sugguestion ? Is it the VISS itself limit or DMA limit ? 

          2、Does your other customers have the same case ?


    Regards,

    bob